CONTROL CHART REPORT
Reports > Control Chart
Generates a Statistical Process Control (SPC) chart report which plots the changes in a statistic.
Selections Description
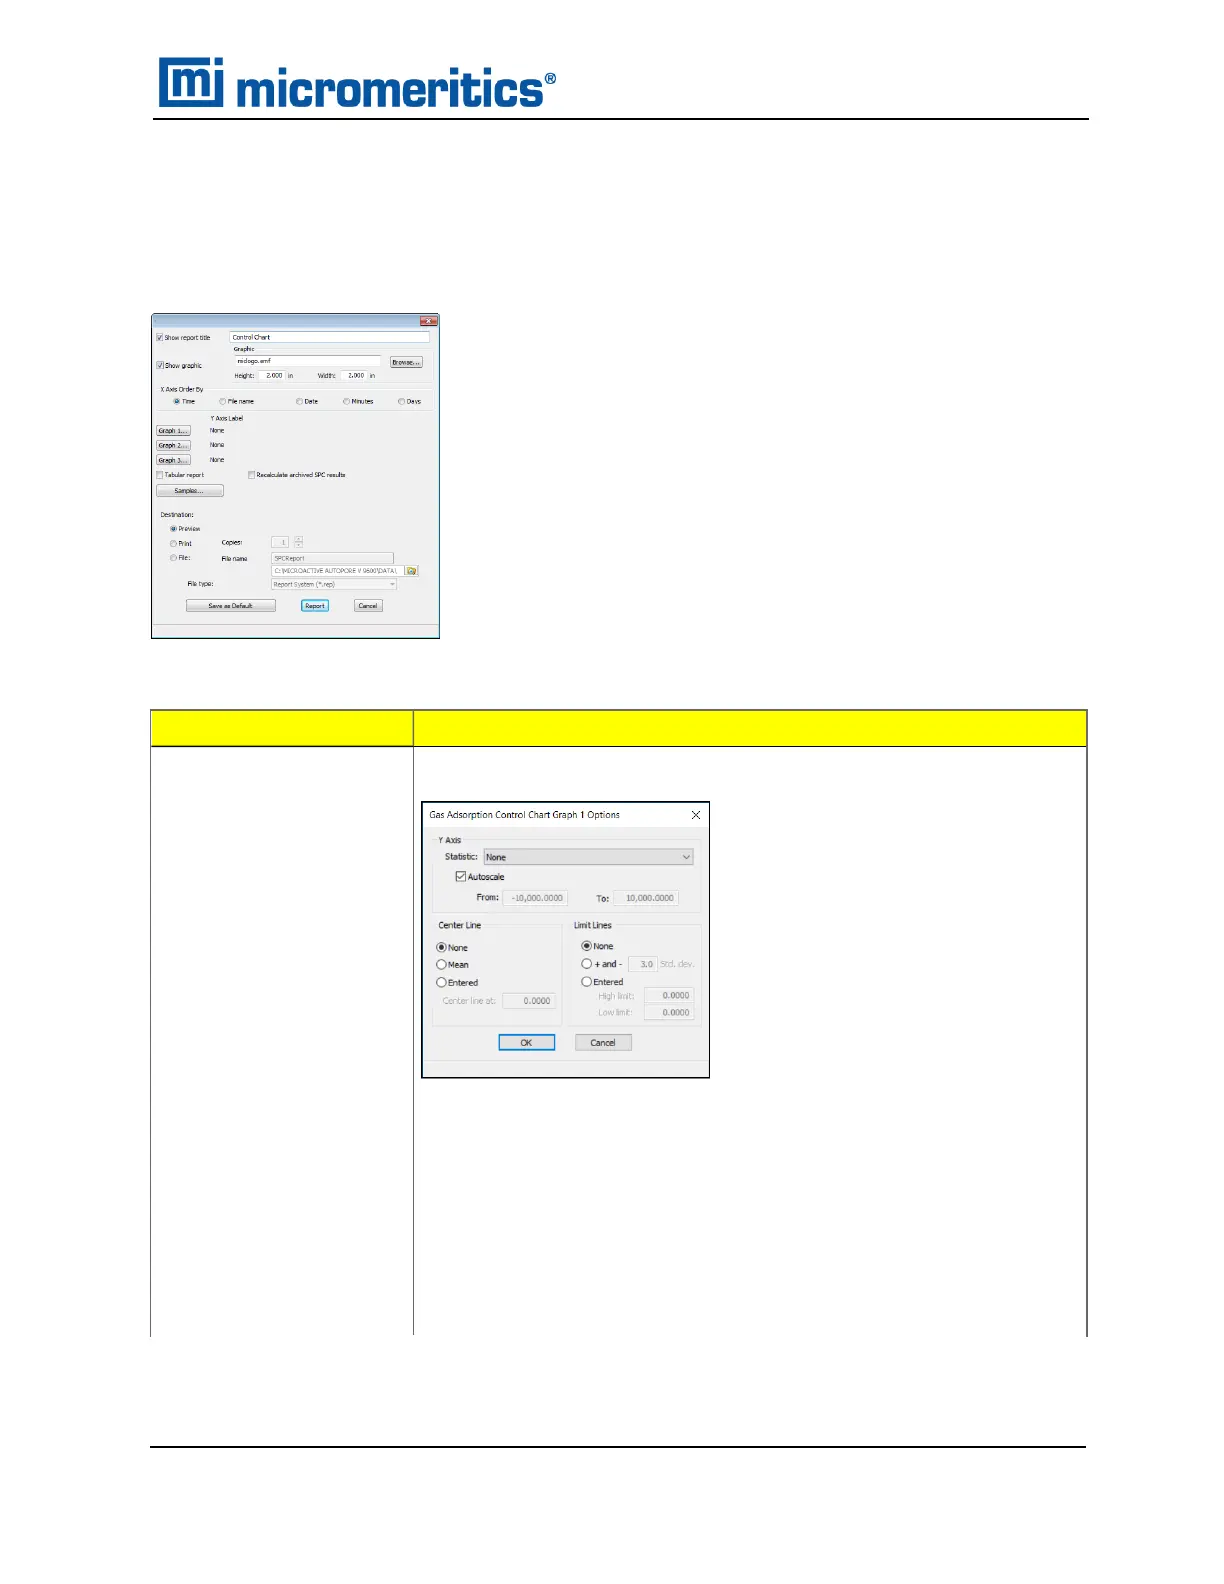
Graph [n] [button]
Defines the y-axis of each graph.
Statistic. Displays the SPC variables selected on the Reports >
SPC Report Options window. The selected variable will be plotted
for each selected sample. This selection also becomes the y-axis
label.
Autoscale. Allows the y-axis to be scaled automatically. To specify a
range, deselect this option and enter a range in the From and To
fields.
Control Chart Report
Control Chart Report
TriStar II Plus Operator Manual
303-42800-01 (Rev M ) — Sep 2023
7 - 7

 Loading...


