ScreenWorks Software Overview
98 0112-0109 H
Features of the Group Statistic Graph are explained in separate
sections below.
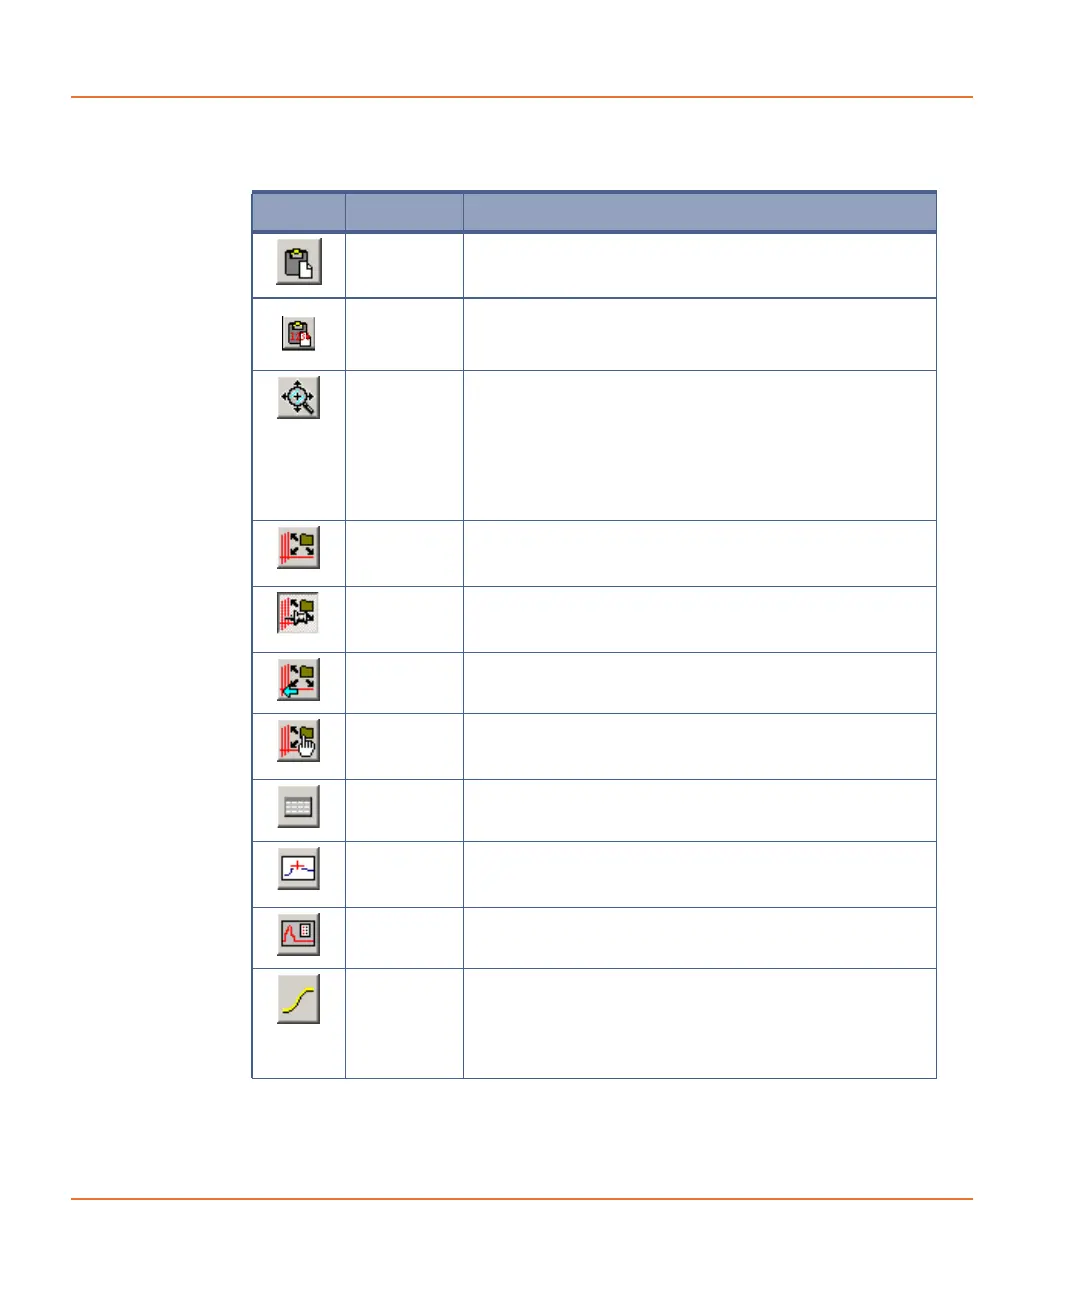
Button Name Description
Copy Graph Copies data in the Group Statistic Graph to the
clipboard so it can be pasted in a different program
such as Microsoft Word.
Copy Graph
Data
Copies Graph Data in the Group Statistic Graph
to the clipboard so it can be pasted in a different
program such as Microsoft Excel.
Zoom Mode Press to enable zoom capability in the graph.
Once the Zoom button is pressed, drag over a
region in the graph to view just that area enlarged
to the full size of the graph.
Alternatively, drag the cursor along a part of the X-
or Y-axis to zoom in on just that axis.
Auto Scale Manual prompt to automatically scale the Group
Statistic Graph to include all data points of the
desired traces.
Auto Scale
Always
Automatically scales the Group Statistic Graph
to include all data points of the desired traces
without manual prompting.
Undo Zoom Rescales graph to the original settings.
Manual
Scale
Graph
Opens the Manual Scale Graph dialog to set the
maximum and minimum values for the X- and
Y-axis graph.
Show/Hide
Data
Toggle button that shows or hides the data for the
selected traces at each read.
Show Point
Labels
Show Point Labels writes the value of each data
point (for example, RLU value) beside the point on
the graph.
Show/Hide
Legends
A toggle button that displays or hides the detail
graph legend.
Show/Hide
Smoothed
Curve
A toggle button that displays or hides the
4-parameter curve fit.
This feature can be displayed at the same time as
Show/Hide Original Trace.
 Loading...