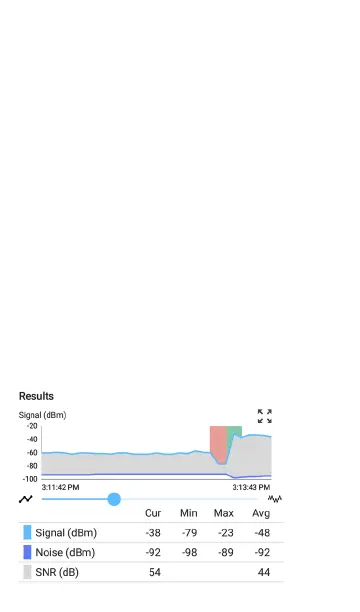
measurements from the last second. Min, Max,
and Avg columns show cumulative meas-
urements.
Signal (dBm) graph: Plots the signal strength in
dBm of the connected AP.
l
Green vertical bars - The tester roamed to a
new AP.
l
Red vertical bars - The tester made a roam
scan.
l
Signal - The AP's signal strength in dBm.
l
Noise - The noise level in dBm on the
channel used.
l
SNR - The network's signal-to-noise ratio in
decibels (dB).
AutoTest App and Profiles
276