Using the Spectrum Views
Opening the Spectrum app automatically
changes the screen orientation and opens the
default view:a Frequency Spectrum graph for
the 2.4 GHz band. You can choose from three
views oflive data: Frequency Spectrum
(heatmap), Waterfall, and Real Time.
Before You Begin
l
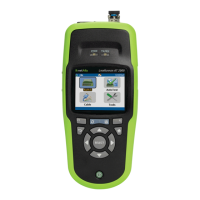
Connect NetAlly's Spectrum dongle to the
top USBport (USBType-A) of your
EtherScope nXG Controlled Edition. (See
Contact NetAlly to acquire the NXT-1000
Portable Spectrum Analyzer if you do not
already have one.)
l
Tap the Refresh icon to clear the current
graph and start new measurements.
l
To get more accurate test results, NetAlly
recommends that you turn off your device's
test and management Wi-Fi and Bluetooth.
(The Spectrum app notifies you if these
services are turned on.)
To turn off test Wi-Fi:
Spectrum Test App
668