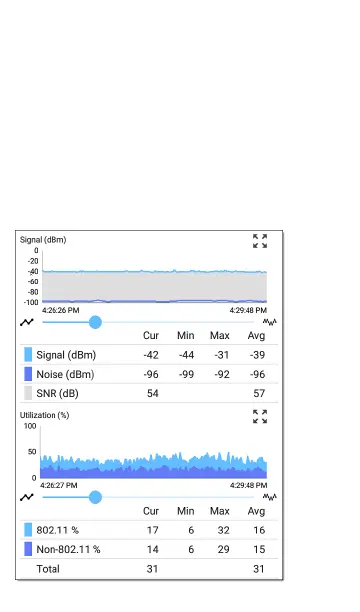
Trending Graphs
Many of the EtherScope nXG Controlled Edition
testing apps feature time-based line graphs of
recorded measurements, which you can pan and
zoom to view different time intervals. For
example, the image below shows the Signal and
Utilization graphs from the AutoTest Wi-Fi Link
Screen.
General Settings and Tools
109