The graphs update in real time and then save
and display data for up to 24 hours (depending
on test type and/or link status).
A legend indicates the measurements that
correspond to each plotted color.
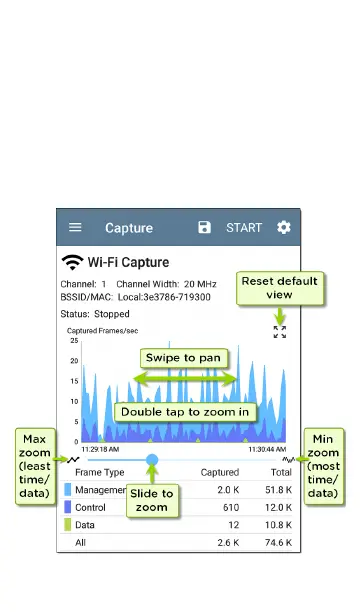
For another example, the image below shows
the Capture app graph.
General Settings and Tools
110