l
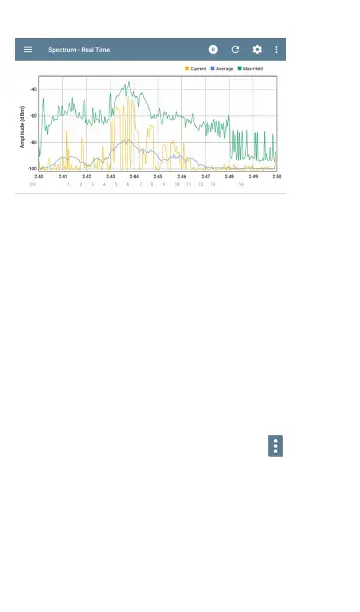
The yellow line indicates the current values.
l
The blue line indicates the average values,
which are calculated using all measurements
accumulated since the graph was last
cleared.
l
The green line indicates the highest
measured value (Max-Hold).
Uploading Results to Link-Live
To send your Spectrum results to the Link-Live
website, tap the action overflow icon at the
top right of the Spectrum screen, and then tap
Upload graphs to Link-Live.
Spectrum Test App
675