This section describes the common elements of
the RF and Traffic Statistics screen. See the topic
for each type of Details screen for differences.
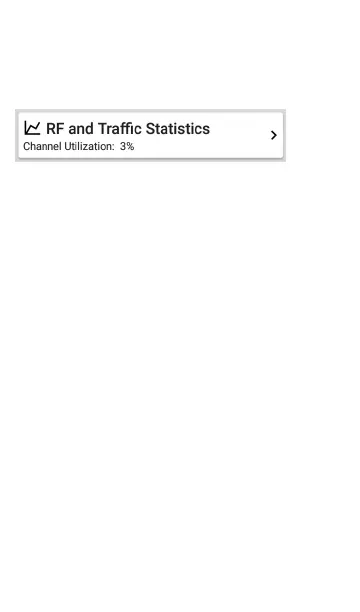
The RF and Traffic Statistics card shows the
Channel number or the Signal strength of the
strongest AP on the channel and the channel's
Utilization percentage.
Tap the card to view graphs of Signal, Noise,
Utilization, and Retries.
To pan and zoom on the graphs, you can swipe,
double tap, and move the slider. See the
Trending Graphs topic for an overview of the
graph controls.
Wi-Fi Analysis App
555