The Channel Utilization graph uses light blue to
show 802.11 channel utilization and dark blue to
show non-802.11 utilization:
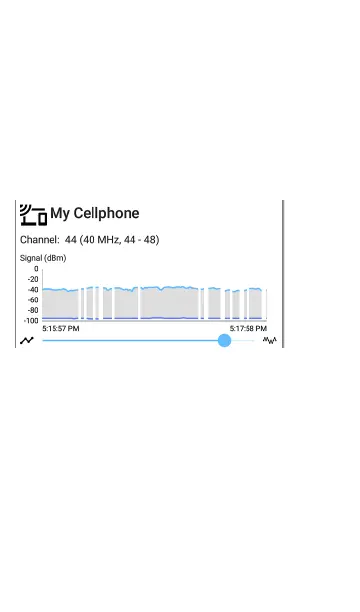
Breaks in the Client RF and Traffic graphs may
occur if the Client is not consistently trans-
mitting, so there is no data for Product to
display during those times.
The Clients RF and Traffic Statistics screen also
displays a graph of Transmit (Tx) and Receive
(Rx) Rates in Mbps, number of Tx Streams, and
Tx Channel Width in MHz.
Wi-Fi Analysis App
611