different measurements. The Limit shown for
each graph is the set Threshold from the cor-
responding Service settings. Measurements that
fall outside the Limit are indicated with a red dot
next to the failing measurement. In the image
above, the test has failed because Frames Lost
Up was above the Limit.
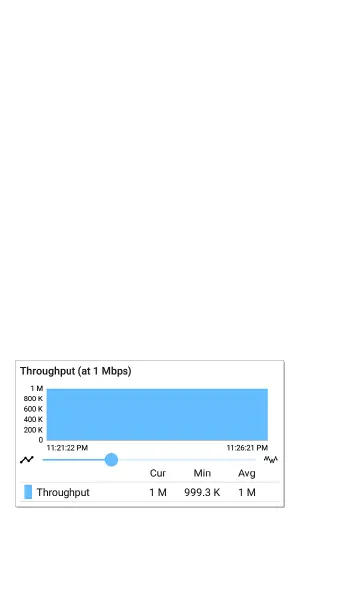
The table also displays the Current, Maximum,
and Average measurements. The Current
columns contain measurements from the last
interval (5 or 30 seconds). The Min, Max, and Avg
columns show cumulative measurements
gathered during the test duration.
Throughput
Performance Test App
724