Reference Manual
00809-0100-4026, Rev FA
July 2009
Rosemount 5400 Series
7-12
Using the Echo Curve
Analyzer with a 375 Field
Communicator
The 375 Field Communicator supports the Electronic Device Description
Language (EDDL) with enhancements that allows viewing of the Echo Curve,
creating an Amplitude Threshold Curve (ATC), and specifying amplitude
thresholds such as the Surface Threshold.
Viewing the Echo Curve
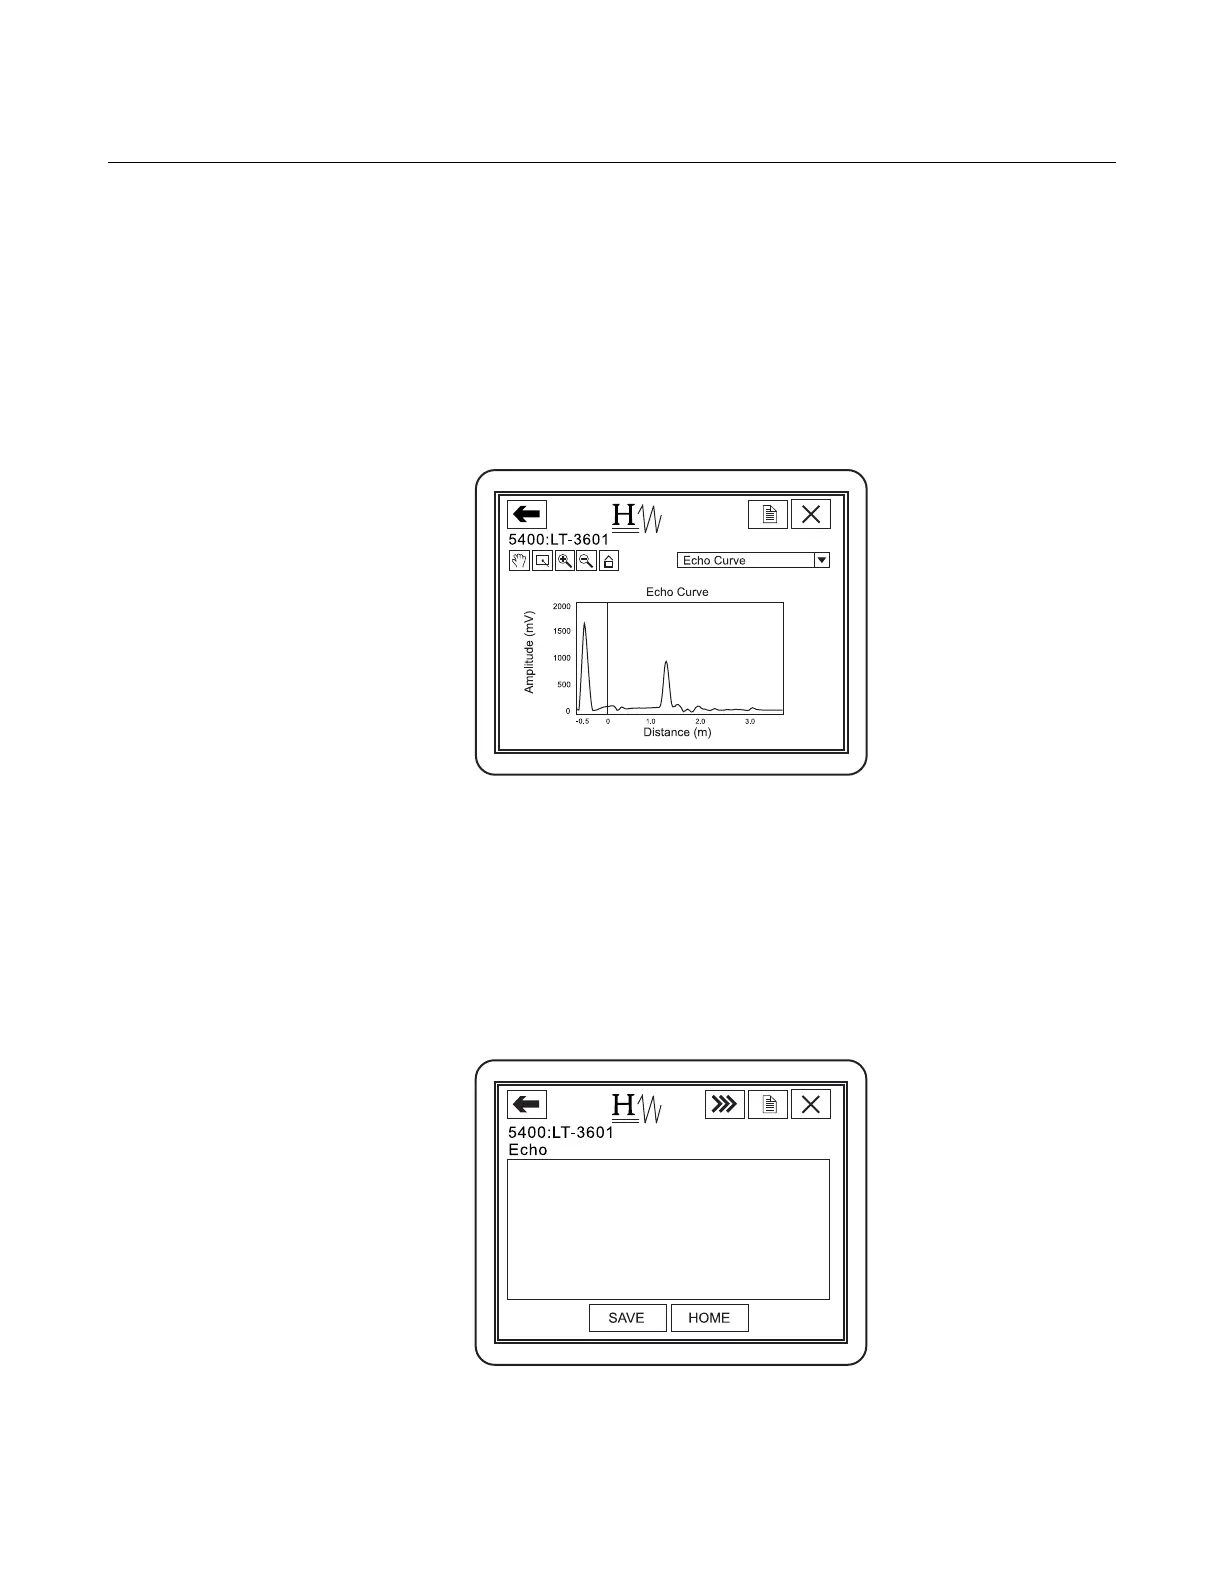
To view the Echo Curve:
1. Select HART command [2, 5, 2, 3].
The Echo Curve appears on the display:
2. Use the Hand and Zoom tools to view specific parts of the Echo Curve.
The drop down list allows for choosing items such as the different
amplitude thresholds to be displayed in the plot.
The Echo Curve plot also shows an ATC if available. See “Amplitude
Threshold Curve” on page 5-11 for more information.
Register False Echoes
To register false echoes:
1. Select HART command [2, 5, 1].
2. Option 1 Found Echo Peaks displays found echoes.
3. Option 2 Add False Echo... lets false echoes be registered based on
distance.
1 Found Echo Peaks
2 Measurement Output
3 Registered False Echoes
4 Add False Echo...
5 Remove False Echo...
Peaks