Reference Manual
00809-0100-4026, Rev FA
July 2009
7-9
Rosemount 5400 Series
USING THE ECHO
CURVE ANALYZER
The Echo Curve in Rosemount Radar Master (RRM) shows the measurement
signal amplitude in the tank and includes the Echo Tuning functionality (see
“Echo Tuning” on page 5-10 for more information on false echo handling).
To plot the measurement signal:
1. Start the Rosemount Radar Master program.
2. Open Device Config/Tools (or Device Config/Setup).
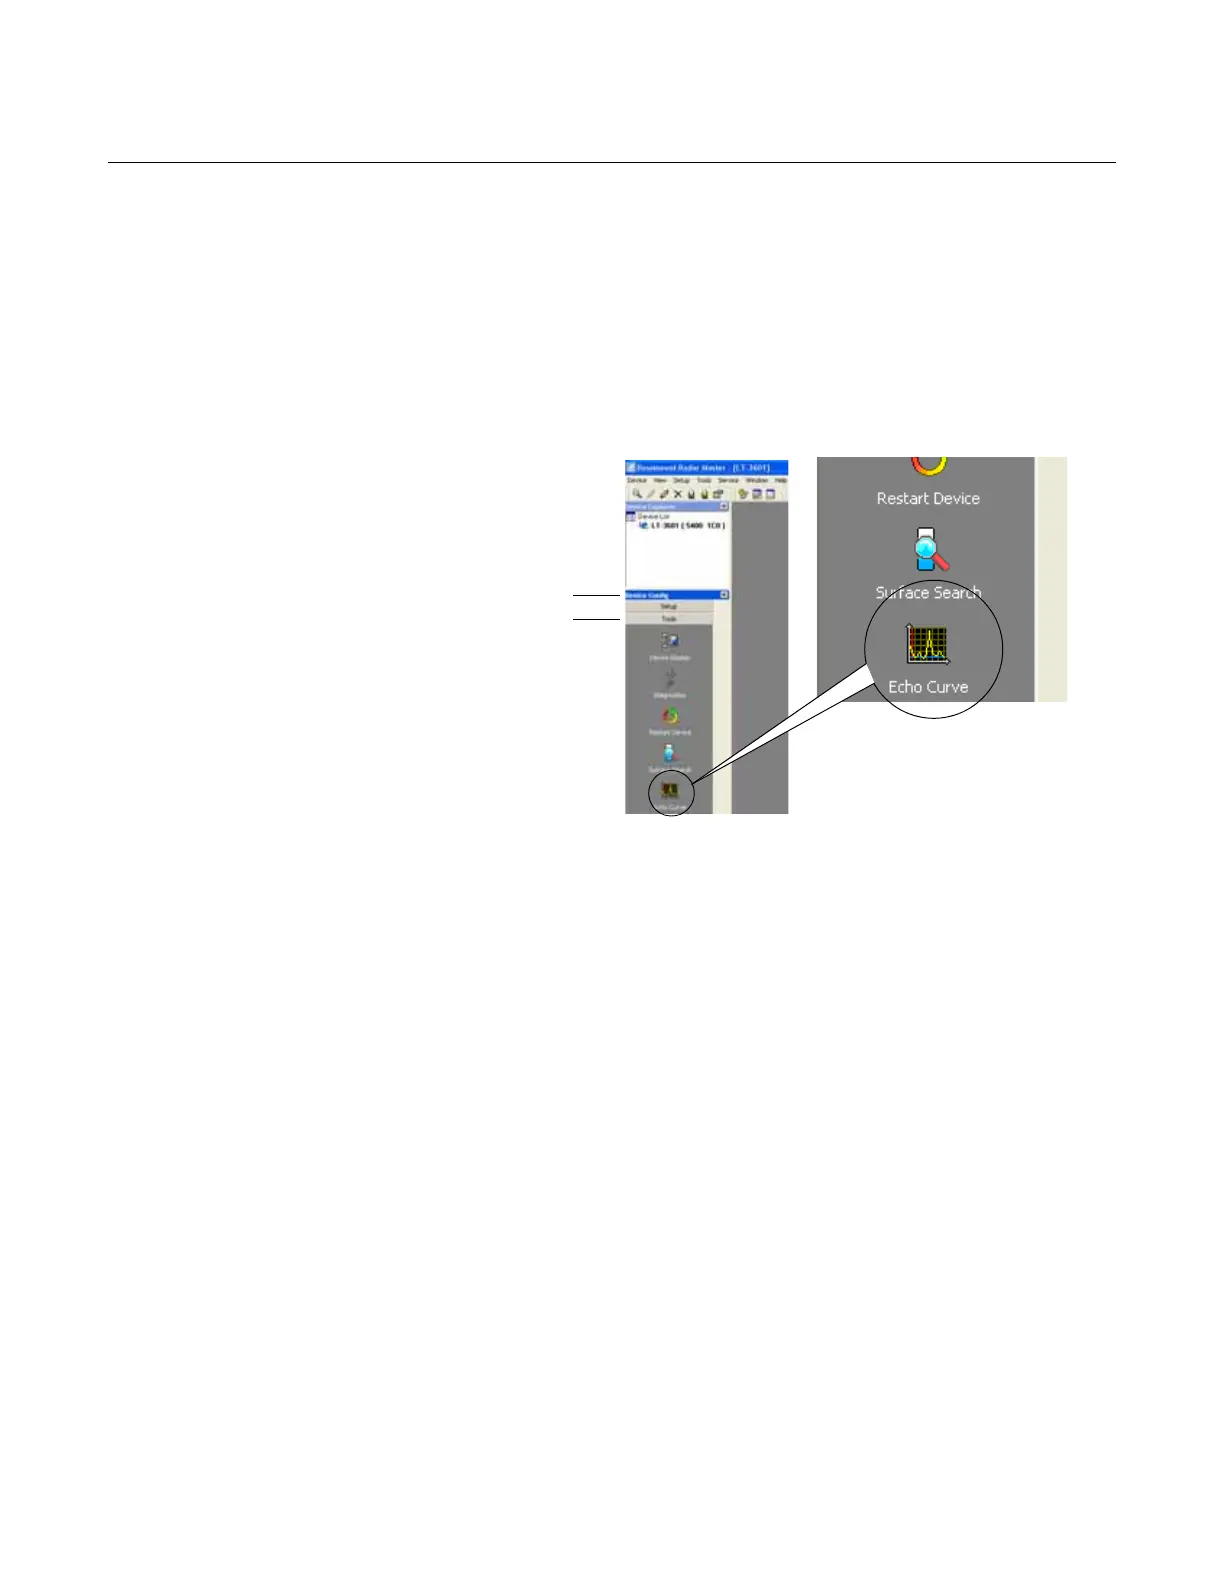
3. Click the Echo Curve icon (see Figure 7-7).
Figure 7-7. The Echo Curve
function is a useful tool for signal
analysis.
4. The Echo Curve Analyzer window appears with the View/Record Mode
tab (or the Configuration Mode tab) selected.
Device ConfigDevice Config
Tools