50 FLOWSIC600 · Technical Information · 8010125 V 4.0 · © SICK AG
Product Description
Subject to change without notice
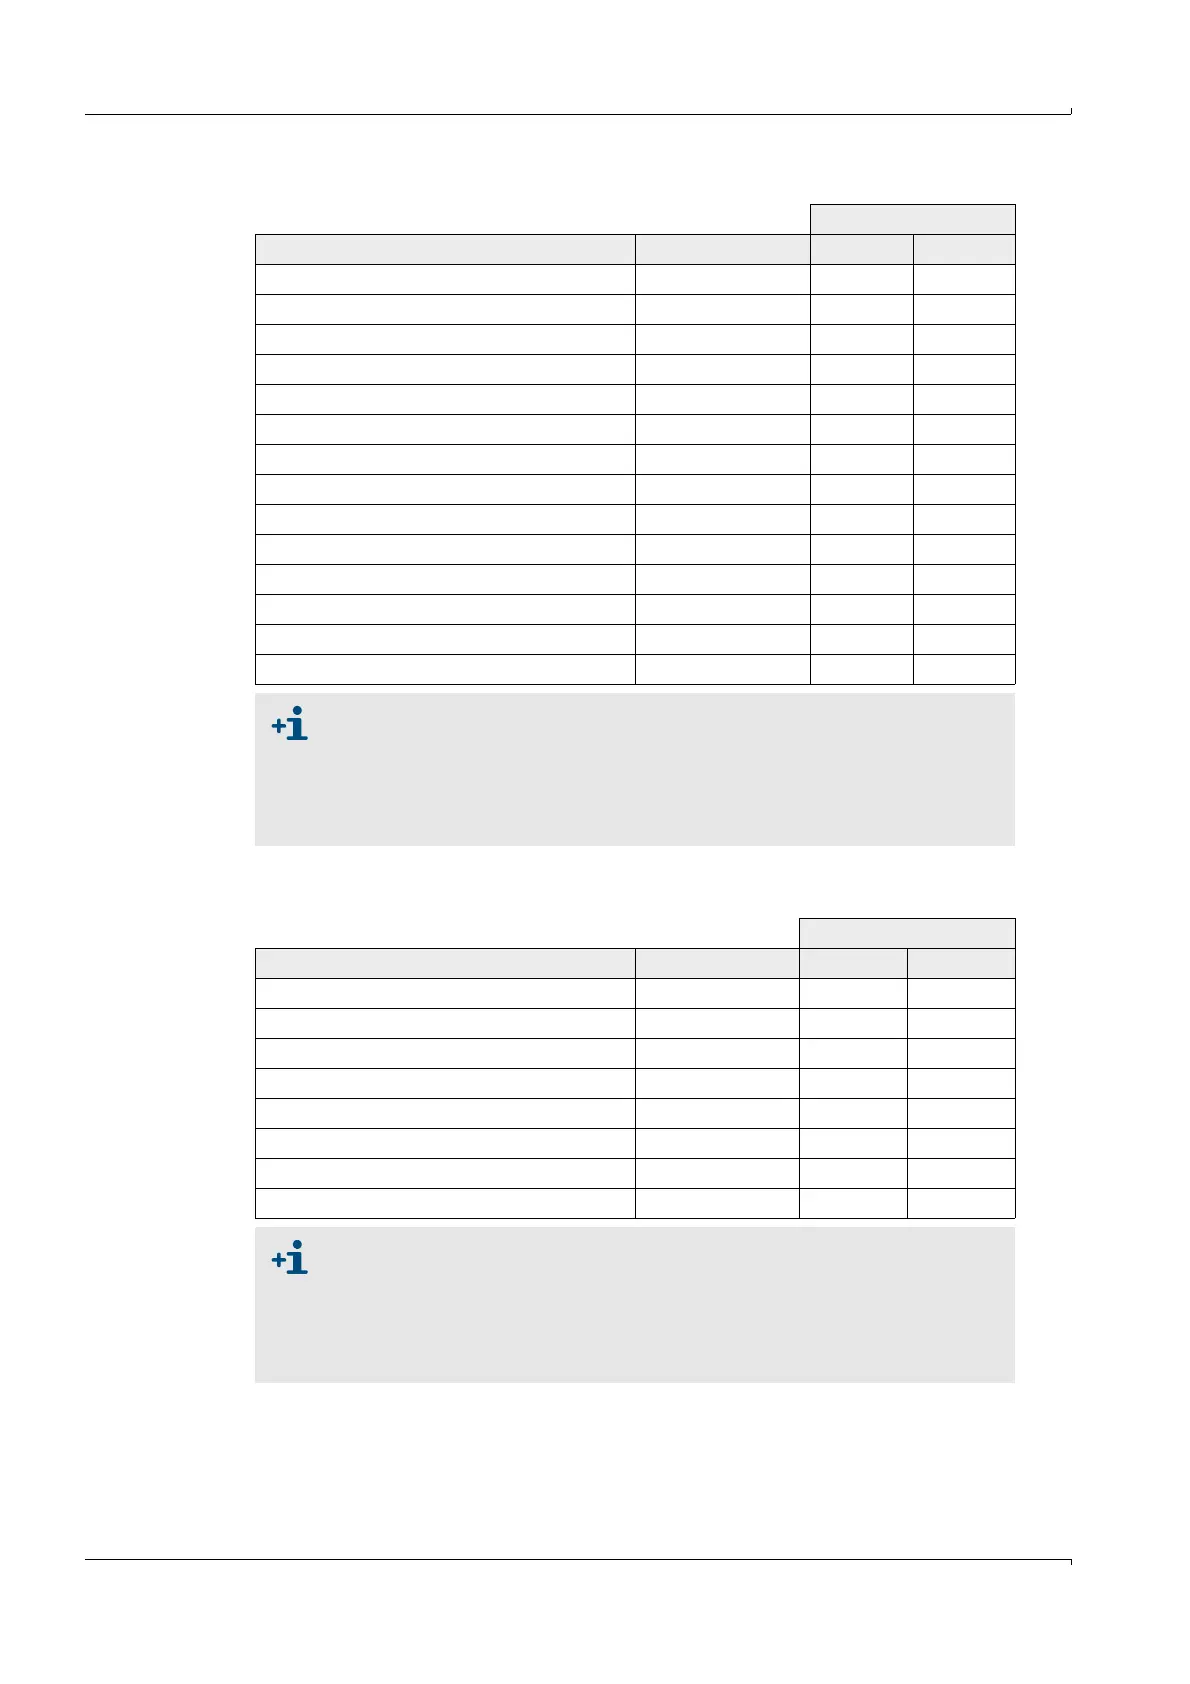
Table 12 Dataset type "Volume Counters"
Table 11 Dataset type "Diagnostic Values"
Unit
Description Abbreviation Metric Imperial
Date/Time when data was saved Date / Time Sec Sec
Flow Time FlowTime % %
Average VOG AvgVOG m/s ft/s
Average SOS AvgSOS m/s ft/s
Profile Profile factor - -
Symmetry Symmetry - -
Performance per path Performance[1..4] % %
Turbulence per path TurbulenceP [1..4] % %
Average VOG per path AvgV [1..4] m/s ft/s
Average SOS per path AvgC [1..4] m/s ft/s
SNR per path SNRPath [1..4] dB dB
AGC per path AGCPath [1..4] dB dB
VOG standard deviation VOG_stdev m/s ft/s
Meter Status (
pg. 179) DLOG Status - -
● The dataset type "Diagnostic values" does not contain any diagnostic
information for gas velocities below the value for Vmin ("LowFlowCutOff",
Reg. #7036). The "Flow time" value shows, for the percentage of storage
cycle time the flow was above Vmin and in the flow direction specified for
the DataLog.
● All diagnostic information is flow-weighted.
Unit
Description Abbreviation Metric Imperial
Date/Time when data was saved Date / Time Sec Sec
Flow Time FlowTime % %
Total volume at flowing conditions (forward) Vo forward m³ acf
Total volume at flowing conditions (reverse) Vo reverse m³ acf
Volume at flowing conditions (forward) Vf forward m³ acf
Volume at flowing conditions (reverse) Vf reverse m³ acf
Averaged Performance AvgPerformance % %
Meter Status (
pg. 179) DLOG Status - -
● The dataset type "Volume Counters" does not contain values for "Averaged
performance" for gas velocities below the value for Vmin ("LowFlowCutOff",
Reg. #7036).
● The "Flow time" value shows, the percentage of storage cycle time the flow
was above Vmin and in the flow direction specified for the DataLog.
● The values for "Averaged performance" are flow-weighted.

 Loading...