62 FLOWSIC600 · Technical Information · 8010125 V 4.0 · © SICK AG
Product Description
Subject to change without notice
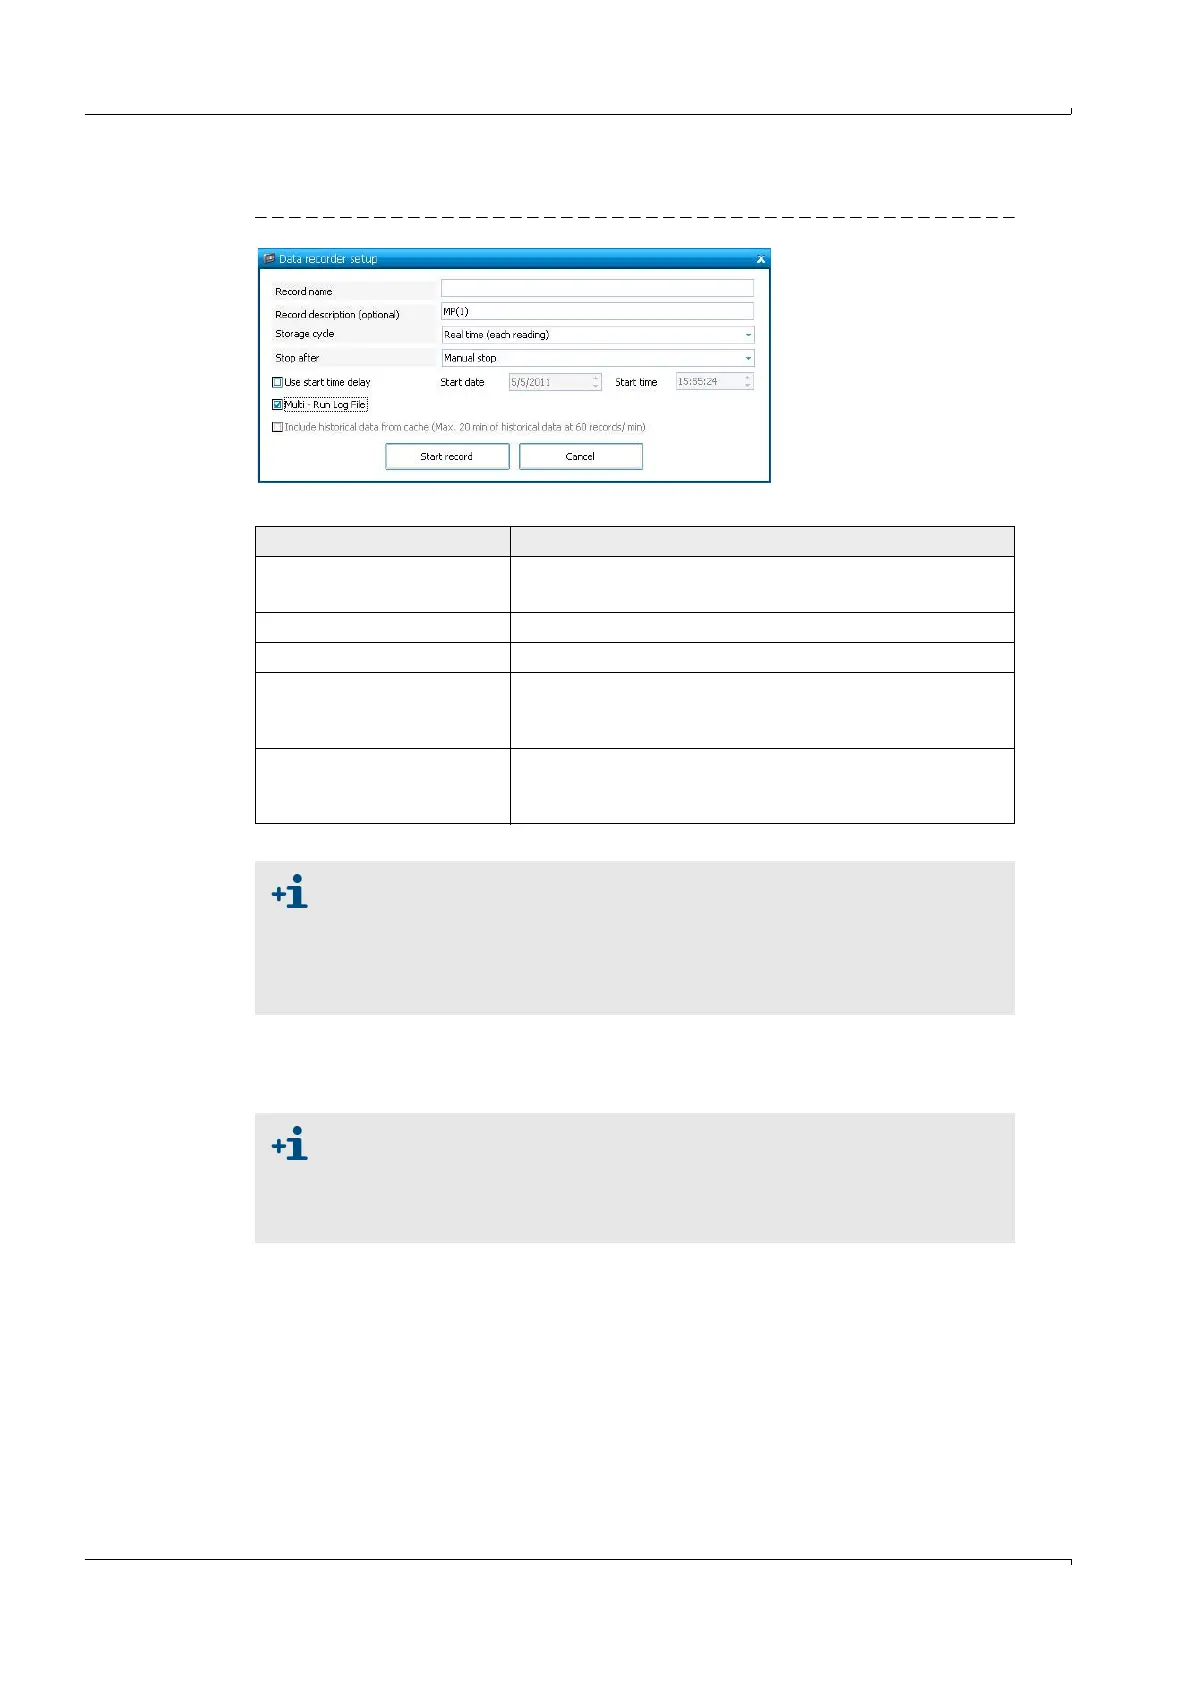
Recording options
Figure 18 "Data recorder setup" window
Table 15 Options available for recording
Playback
The playback of a recording works similar to a video recorder. While the record is played,
the charts and graphs show the recorded data.
Export
The recorded data can be exported to an Excel file (.xls) for further processing.
Option Description
Record name
Record description (optional)
Specify a record name and a record description (optional).
Storage cycle Frequency for storing records (1 sec .. 1h, or real time)
Stop after Recording stops after set time or after manual stop.
Multi - Run Log File
Valuable setting when running sequential tests. It enables
a manual ‘stop and start‘ of the recording. Makes
sequential logfile-naming simple.
Include data of history
(cache)
Includes the data stored in the cache (historical data). See
"Paths / Memory" tab in the "Program settings" to set the
maximum period, for which the cache is saved.
● The "Data recorder" records all data except for the signal waveforms. To
record the signal waveforms in addition to the other records, go to the "Path
diagnosis" page, where the signal waveforms are displayed and click the
"Record signal" button.
● A diagnosis session with all relevant data recorded (including the signal)
can be created via the menu "Tools / Diagnosis Session".
● You can only playback records of a meter to which you are connected online
or offline.
● The playback feeds the recorded data to the software‘s framework so that
all charts and graphs display the recorded values, not the live data from a
connected meter.

 Loading...