Flow Calibration
FLOWSIC600 · Technical Information · 8010125 V 4.0 · © SICK AG 73
Subject to change without notice
3.2.3.2 Adjustment using a polynomial
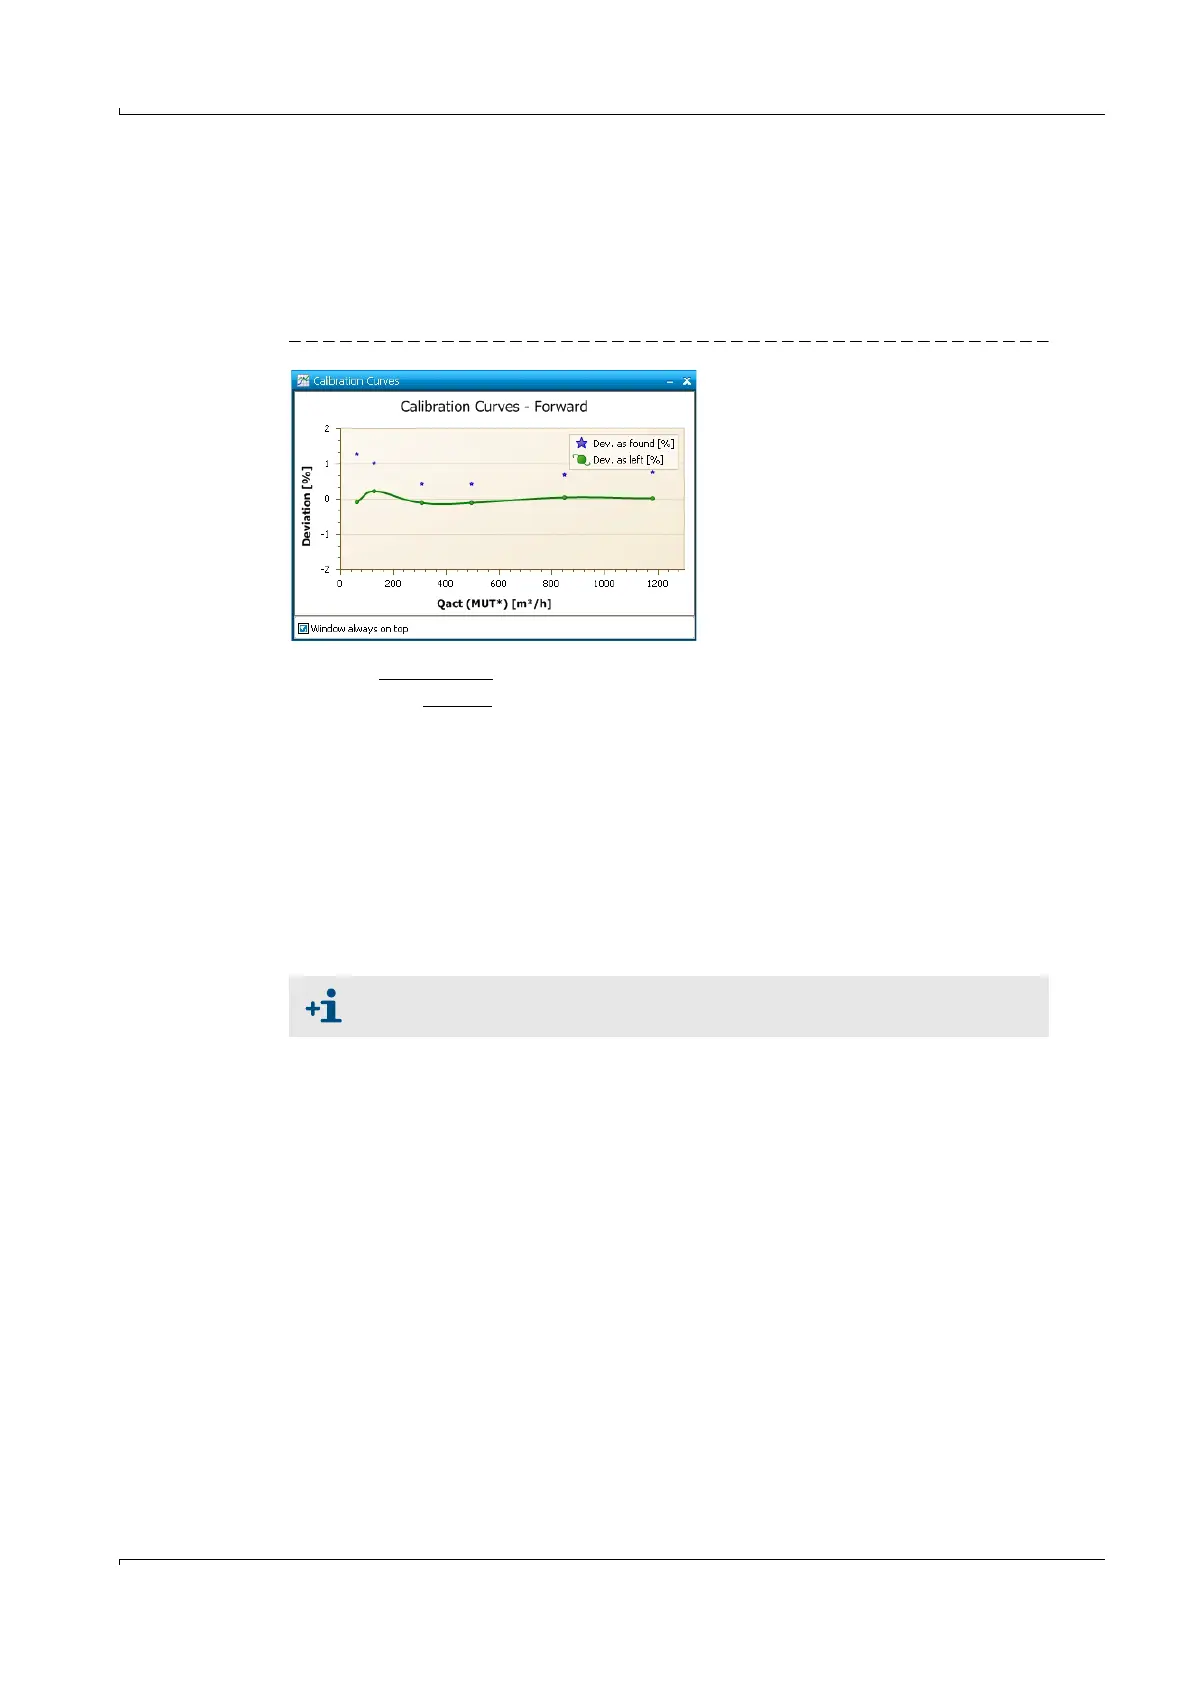
Polynomial correction improves the linearity of the error curve and corrects the WME to a
lower value. The difference between the polynomial curve and the test flow rates "Dev. as
found" is the remaining error after adjustment, represented in the error curve ("Dev. as
left"). The calculation procedure mathematically shifts the polynomial to the zero line
(
Figure 20).
Figure 20 Calibration curve for adjustment with polynomial
The curve defined by the polynomial equation should be very close to the error curve for
the meter under test (MUT) at each of the test flow rates. To optimize the curve, three
different polynomial types are available:
E'(Q) = a
-2
Q
-2
+ a
-1
Q
-1
+a
0
+a
1
Q +a
2
Q
2
(1) 7 test flow rates
E'(Q) = a
-1
Q
-1
+a
0
+a
1
Q +a
2
Q
2
(2) 6 test flow rates
E'(Q) = a
-1
Q
-1
+a
0
+a
1
Q (3) 5 test flow rates
For adjustment with polynomial the above given minimum number of test flow
rates must be determined.
 Loading...