More information:
•
see "“Functional configuration” menu", page 73
10.1.4 “Graphic display” area
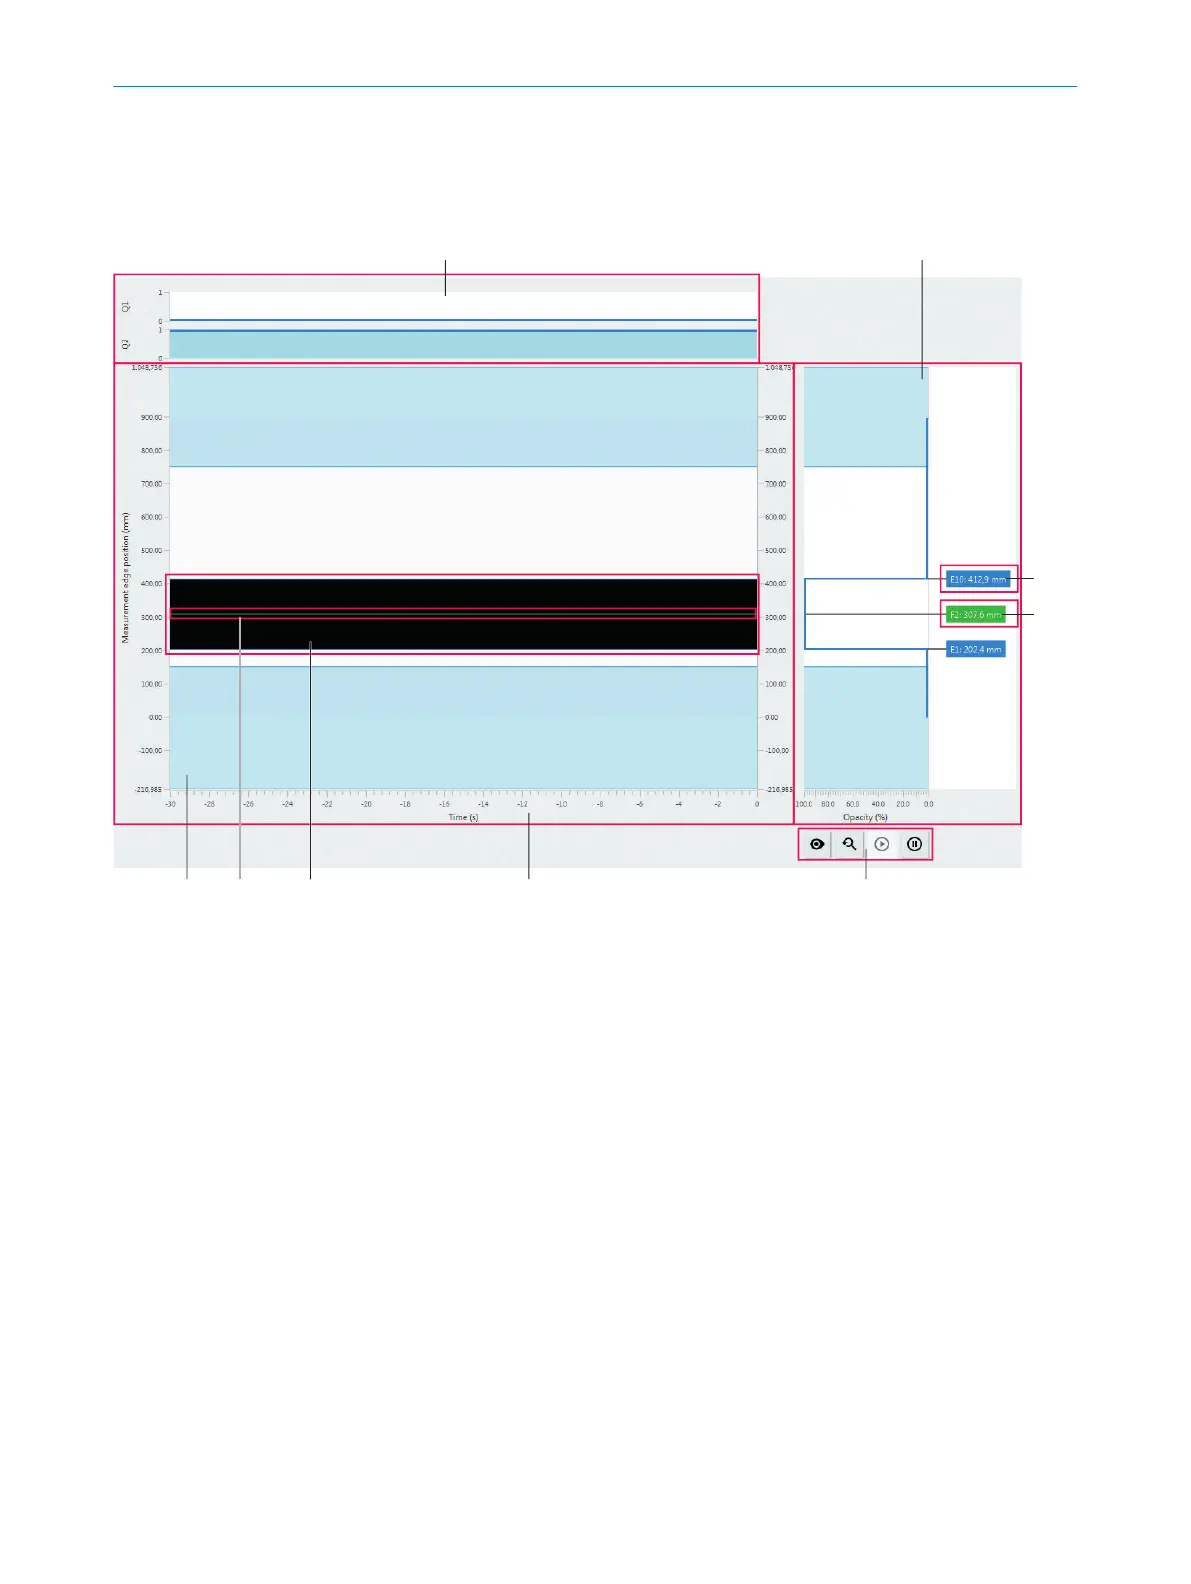
Figure 46: “Start” page, “Graphic display” area
1
Histogram for the Q switching outputs and inputs. You can parameterize this
area using button 5 by selecting and de-selecting switching outputs in the
perimeter of the display.
2
Current attenuation (opacity) in %
3
Current measured value and label of edge (marked in blue)
4
Calculated current value and designation of a center position defined here as
function 2 (here between edge 1 and edge 10) (marked in green)
5
Buttons for the graphic display
6
Histogram of object, edge and center positions
7
Detected and measured object (black surface, grayscale value according to
the attenuation of the object)
8
Center position between 2 edges (green line)
9
Blue surface from above / below: Blanked area
Center blue surface: Empty modules (not shown here)
Fields marked in blue
The fields marked in blue show the measured edges with edge number and dimension.
These fields and associated object are displayed as soon as the MLG-2 detects and
measures objects with edges.
CONFIGURATION WITH SOPAS 10
8024643/2019-09-02 | SICK O P E R A T I N G I N S T R U C T I O N | MLG-2 WebChecker
61
Subject to change without notice