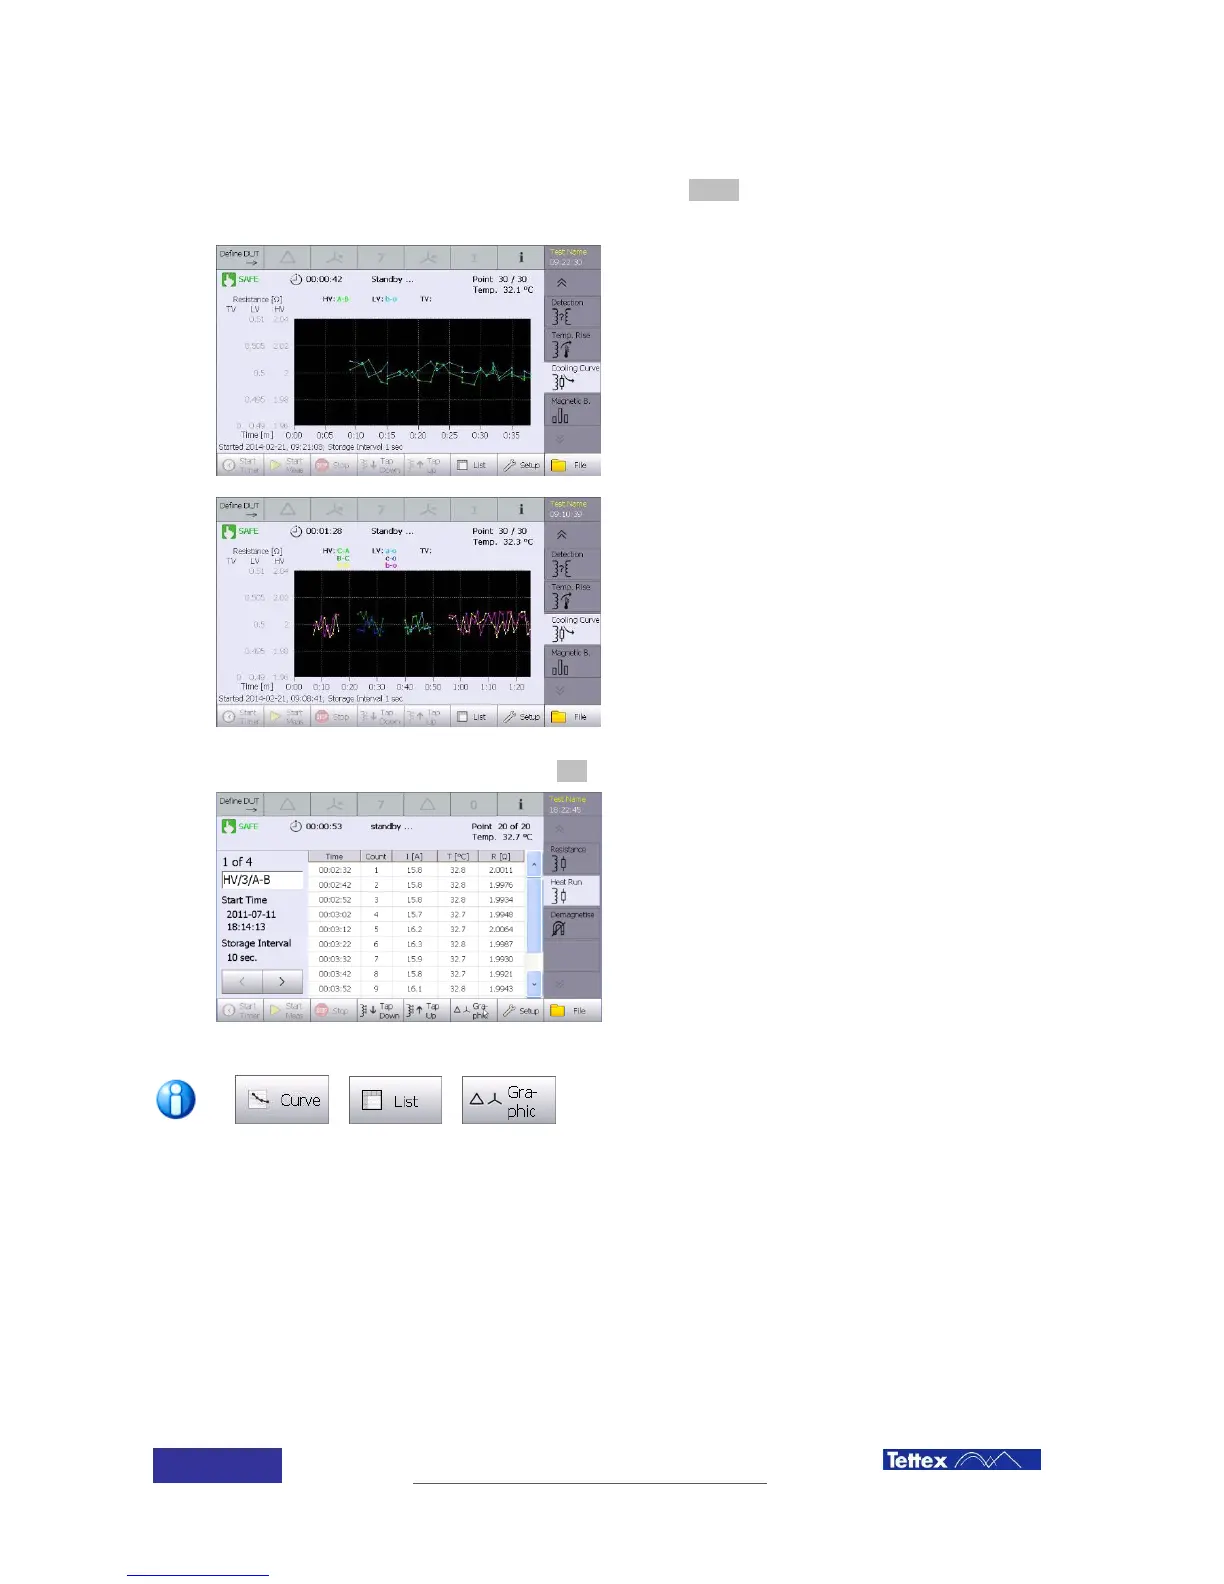
To see the measured results in graph format, select the Curve in the function key bar.
Measured results are shown in graph mode by
selecting the curve button.
If additional tests of other phases, windings or
taps are performed, the graph shows the
results for the last 9 windings measured.
Time is shown from the point of disconnection.
Measured results for a three phase
(sequential) test display the readings during
the (t2-t4) interval and the single phase
measurements after time t4.
Time is shown from the point of disconnection.
There are no readings during the
charging/discharging time for each phase.
To see the measured results, select the List in the function key bar.
Measured results are shown in a table mode
by selecting the list button.
The function keys in the bottom bar cycle through
the sequence curve → list→ graphic → curve
9.3.9 Export results
See chapter “Data Handling” for information about exporting and printing results.