8.
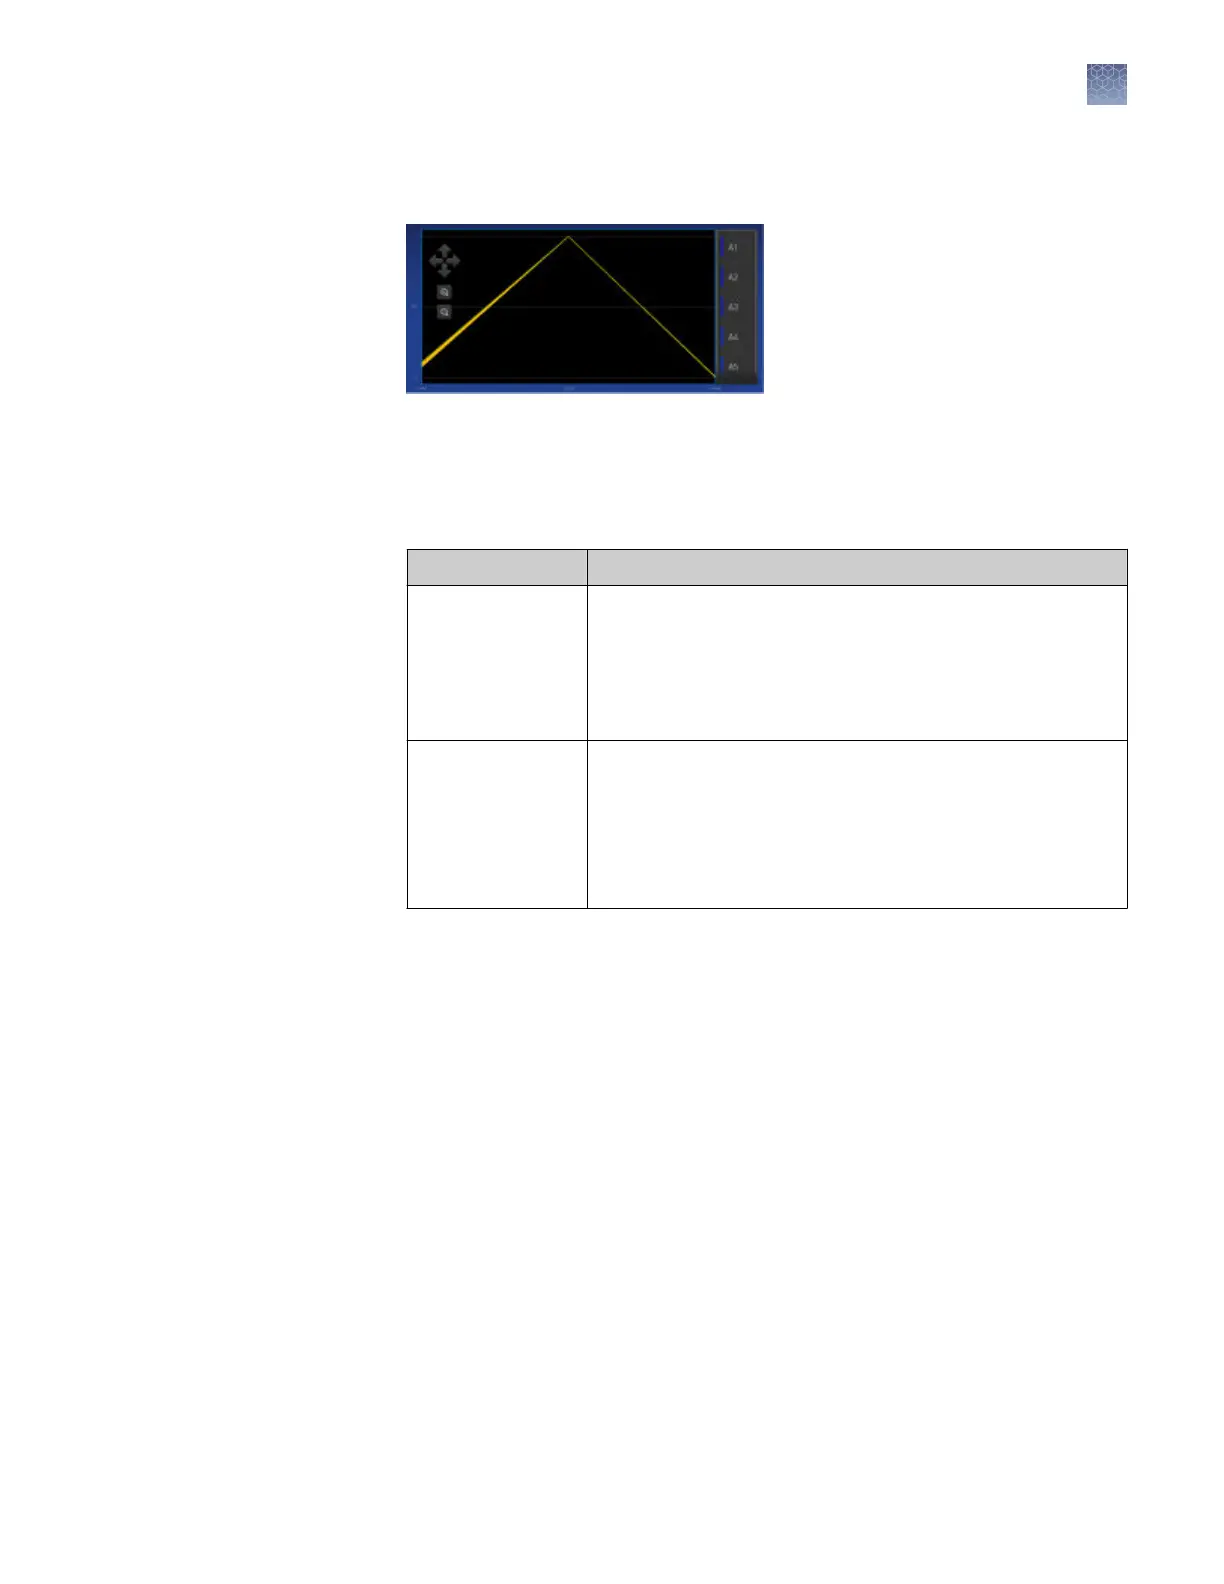
Review the plot. Passing calibration results show uniform signals with peaks that
are aligned with the dye wavelength.
Figure 3 Example dye calibration plot
Note: The peaks for your dye may align with a different filter set.
9.
Select an action depending on whether the custom dye calibration passed or
failed.
Calibration status Action
Passed
• Touch Accept Results or Reject Results.
Note: Accepting the results saves the calibration data to
the instrument and overwrites existing data.
• (
Optional
) Touch Transfer EDS to transfer the calibration
data to a USB.
Failed
• Perform the calibration again using a new custom dye
plate. Create the plate using the next dye concentration
greater than the optimal dye concentration determined in
“Use a dilution series to determine an optimal custom dye
concentration“ on page 62
• See “Troubleshoot calibration failure“ on page 55.
10.
Unload the plate from the instrument.
Note:
·
You must also add the custom dye to the QuantStudio
™
Design and Analysis
Desktop Software dye library before creating, running or analyzing experiments
that use custom dyes.
·
To perform a custom melt experiment, you can either create a Standard Curve or a
Custom experiment with melt, then specify the data points per degree in the
method.
Chapter 5 Calibrate and verify instrument performance
Calibrate for a custom melt curve experiment
5
QuantStudio
™
1 Real-Time PCR System Installation, Use, and Maintenance Guide
69