Stratus OCT User Manual PN 2660021134133 A
Analysis Protocols
6-29
population, the percentiles apply to each particular RNFL thickness measurement
as follows:
• The thinnest 1% of measurements fall in the red area. Measurements in red
are considered outside normal limits (red < 1%, outside normal limits).
• 5% of measurements fall in the yellow area or below (1% yellow < 5%,
suspect).
• 90% of measurements fall in the green area (5% green 95%).
• The thickest 5% of measurements fall in the white area (white > 95%).
Understanding Guided Progression Analysis
GPA Advanced Serial Analysis guides you in the
analysis of progression by providing a
statistical analysis of RNFL thickness average versus age. When the analysis includes
compatible exam data from four or more visits (per eye), the analysis output includes a
linear regression analysis and reports whether or not any observed RNFL loss over the
included visits is statistically significant with 95% or higher confidence.
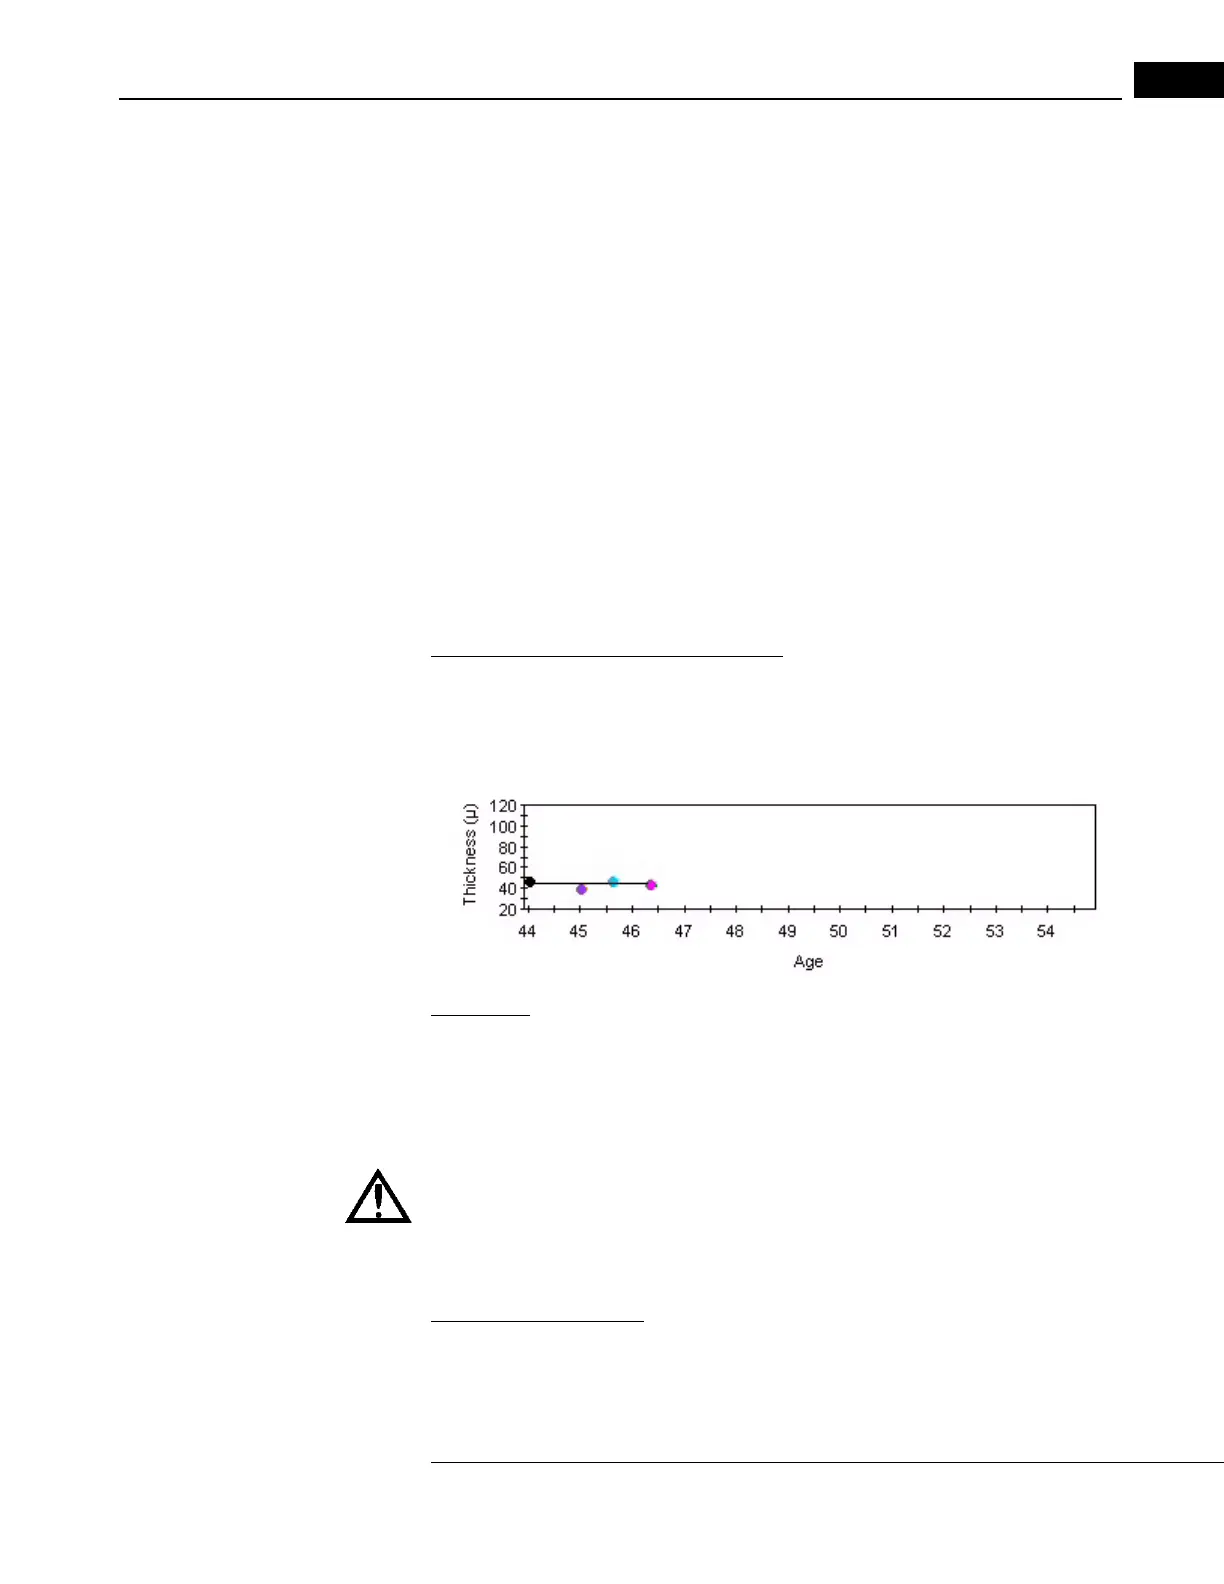
RNFL Thickness Average vs. Age Plot
The RNFL thickness average versus age plot by itself allows you to visually examine any
potential trends in the data over time. The graph color-codes each point on the plot of
average thickness to match the RNFL thickness data table—for instance, the pink point
corresponds to the fourth row in the table.
Trend Line
The line on the plot represents a linear regression to determine if there is a statistically
significant rate of RNFL loss. Linear regression is a common method for determining if a set
of data that is subject to normal variability is consistent with a linear trend. If the trend is
decreasing, the patient may be losing nerve fiber layer.
WARNING: The trend line and regression result represent a statistical analysis.
The clinician shoul
d review all scans and all other clinical information, and use
his or her own judgment to determine if clinically relevant change is occurring
in the patient.
Regression Result Text
The regression result text below the plot reports the regression analysis result.
Rate of change: -0.609 +/- 10.2µ/year*
Statistically not significant P > 5%