Analysis Protocols
Stratus OCT User Manual PN 2660021134133 A
6-28
Application: Select GPA Advanced Serial Analysis to do a statistical analysis of RNFL
thickness over time. You can apply this analysis simultaneously to up to eight OD and/or
eight OS scan groups of equal radius and same scan type. All scans you choose must be
from either RNFL Thickness (3.4) or Fast RNFL Thickness (3.4).
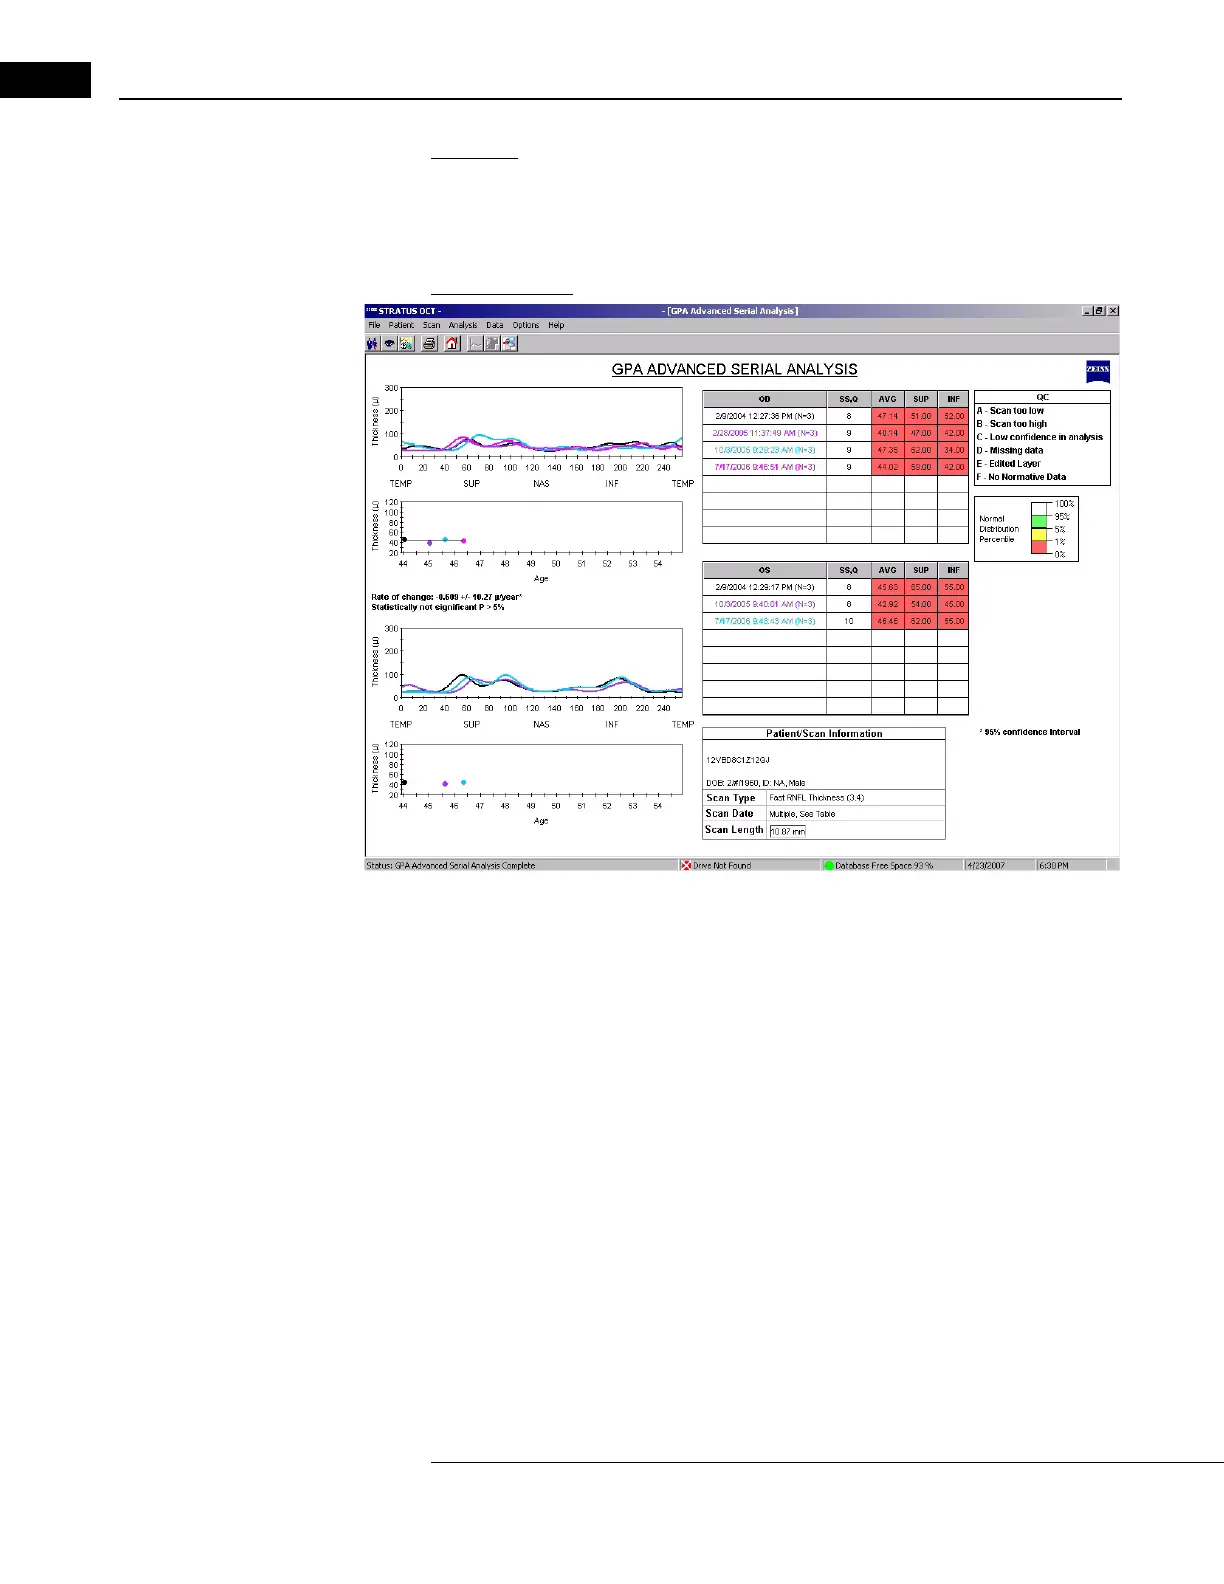
Output Display
For each eye analyzed, the display includes:
• The upper
graph draws lines for RNFL thickness versus A-scan location (and TSNIT
location).
• The lower
graph plots data points for RNFL thickness average versus age. If four or
more points are plotted, the lower graph also will include a regression line, and text
below the graph will report the rate of change (with standard deviation) and whether
any observed RNFL loss trend is statistically significant.
• R
NFL thickness data table: The table color-codes each exam, which is identified by
date, time and number of scans; the same colors are applied to the graph lines and
points to distinguish the exams there.
• The table also includes an SS
,Q column, indicating for each exam the signal
strength (SS) value and any quality (Q) messages that apply. The QC legend at
upper right explains the quality messages that may be indicated by the letters A
through F.
• The table provides numerical RNFL thickness averages—overall and for the
superior and inferior halves. Each thickness average value is highlighted by the
applicable normative data color. Among same-age individuals in the normal