Stratus OCT User Manual PN 2660021134133 A
Analysis Protocols
6-31
Output Display
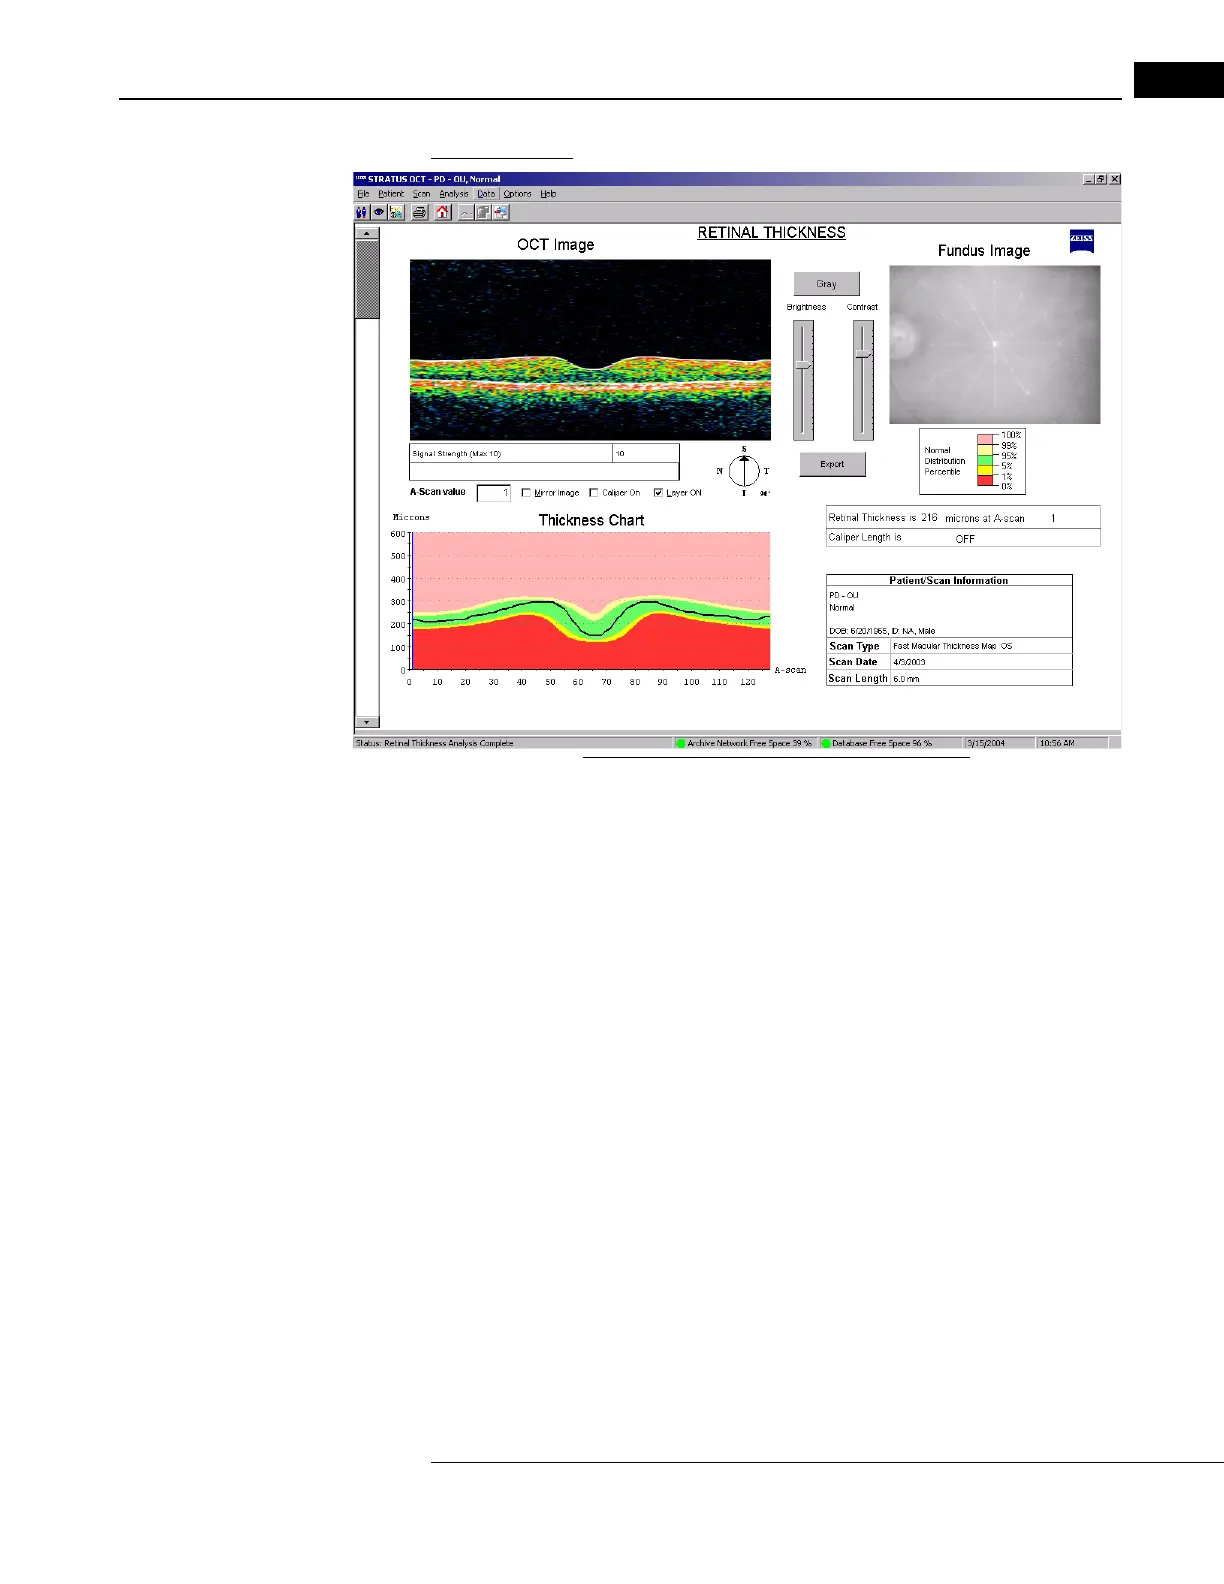
Figure 6-16 Retinal Thickness Analysis Output
• The output graph shows retinal thickness (black line, in micrometers) on the vertical
axis versus A-scan location on the horizontal axis. The scale is linear. If you analyzed
more than one scan, use the scroll bar on the left to see results for the other scans.
• You can find the retinal thickness at any one of the A-scan locations. Drag the pointer
anyw
here in the scan image or type in the A-Scan Value field and a vertical line
corresponding to the selected A-scan location appears on the graph. Retinal
Thickness at that location appears in micrometers at bottom right.
• Click the Caliper ON ch
eckbox to measure distances between the cross-shaped
calipers that appear. Caliper Length appears at bottom right.
• Click the Mi
rror Image checkbox to horizontally reverse the scan image and the
corresponding Thickness Chart.
When applied to a Fast Macular Thickness Map (Fast Mac) scan, the normative
data color code applies to e
ach particular A-scan location in the graph. The resulting color
bands of light red, light yellow, green, yellow and red indicate the normal distribution
percentiles for the age-matched normative data. Among same-age individuals in the
normal population, the percentiles apply to each particular retinal thickness measurement
as follows:
• The thickest 1% of measurements fall in the
light red area. Measurements in light red
are considered outside normal limits. (light red > 99%, above normal limits).