6253 DC Voltage Current Source/Monitor Operation Manual
2.8 Measurement Data Graph Display
2-34
2.8 Measurement Data Graph Display
This chapter describes how to view the measurement data saved in the memory in the sweep source mode.
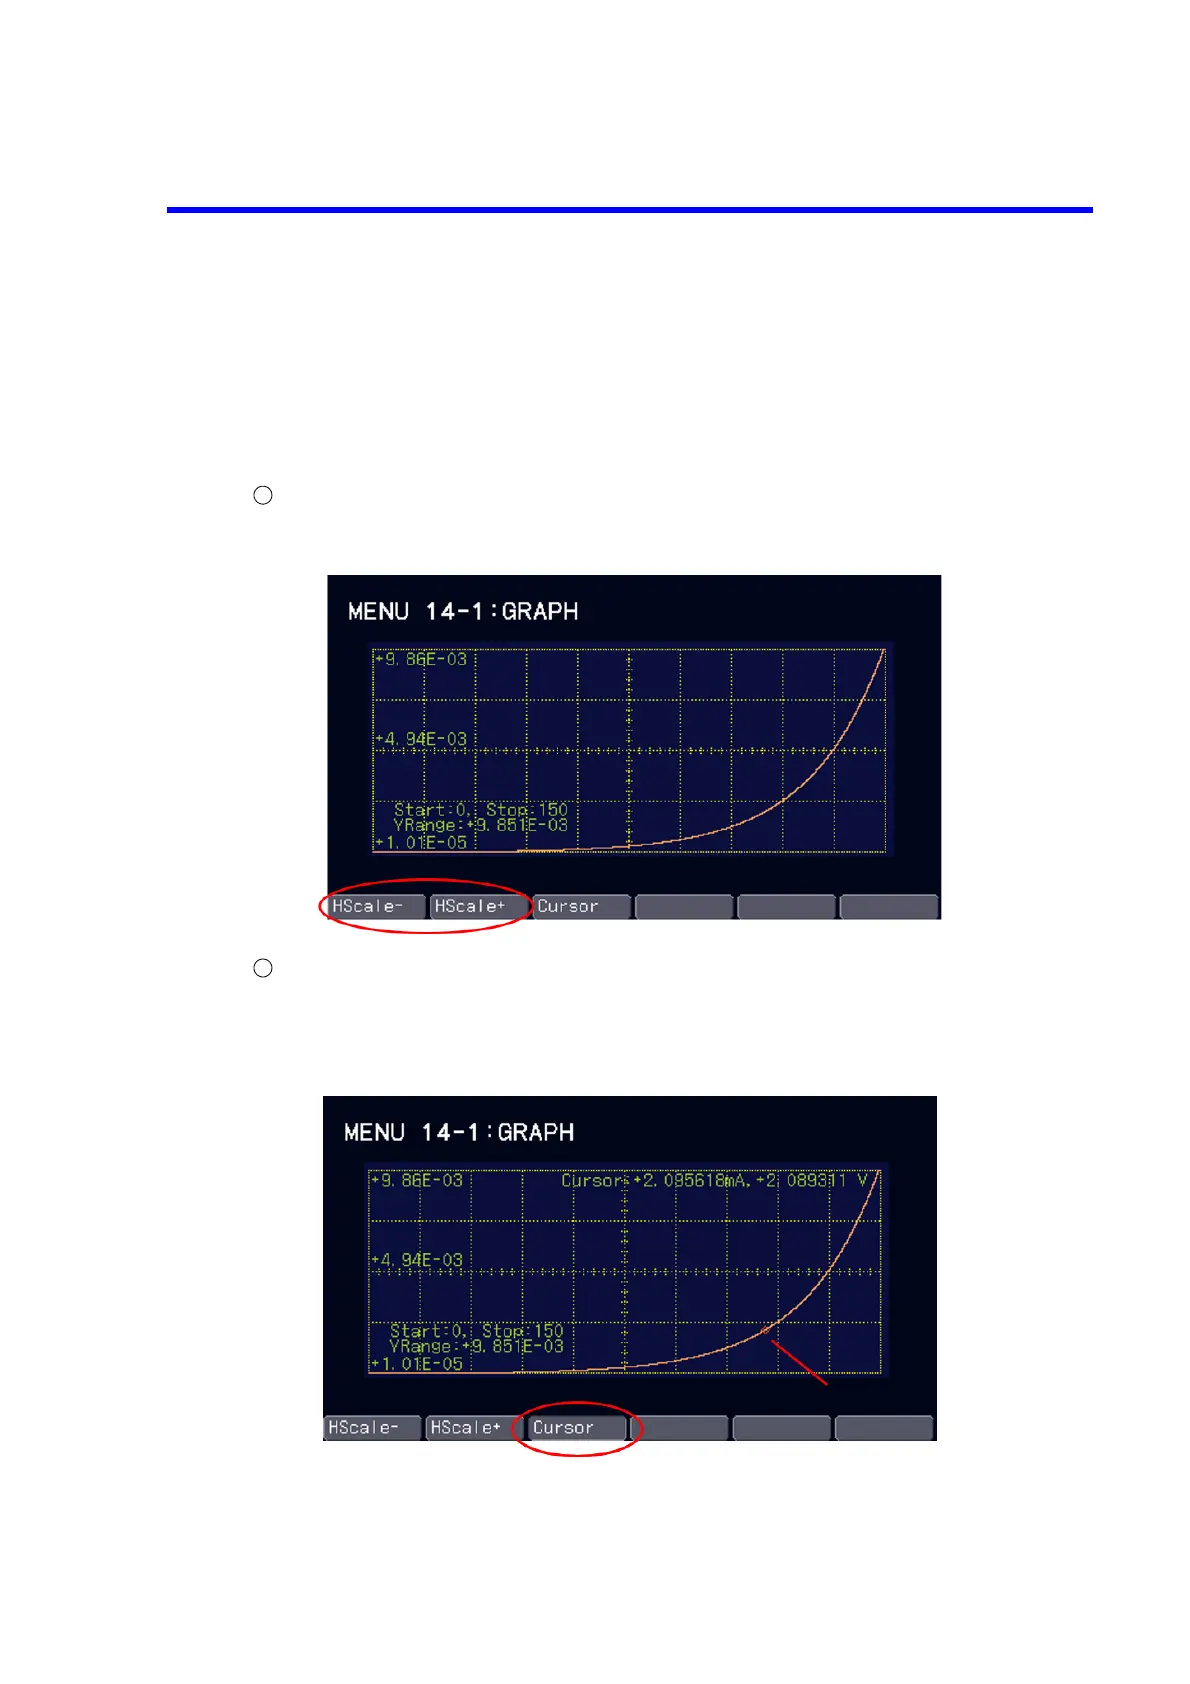
To display the graph, choose 14) Graph on the MENU layer.
1) Graph: Displays a graph that indicates the step numbers in the memory on the vertical axis and the
measured values on the horizontal axis.
Graph zoom-in/zoom-out
Press the soft key HScale+ to halve the display range of the horizontal axis.
Press the soft key HScale- to double the display range of the horizontal axis.
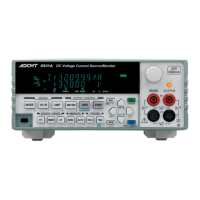
Cursor display
Press the soft key Cursor to turn ON or OFF the cursor display.
Rotating the rotary knob with the cursor display ON will move the cursor on the graph. At this time,
the monitor value and the measured value at the cursor position are displayed on the upper right on
the graph.
To move the cursor easily, after enlarging the display with the soft key HScale+, scroll the graph by
rotating the rotary knob and then turn ON the cursor display with the soft key Cursor.