Agilent 4150 TapeStation System Manual 105
Good Measurement Practices
7
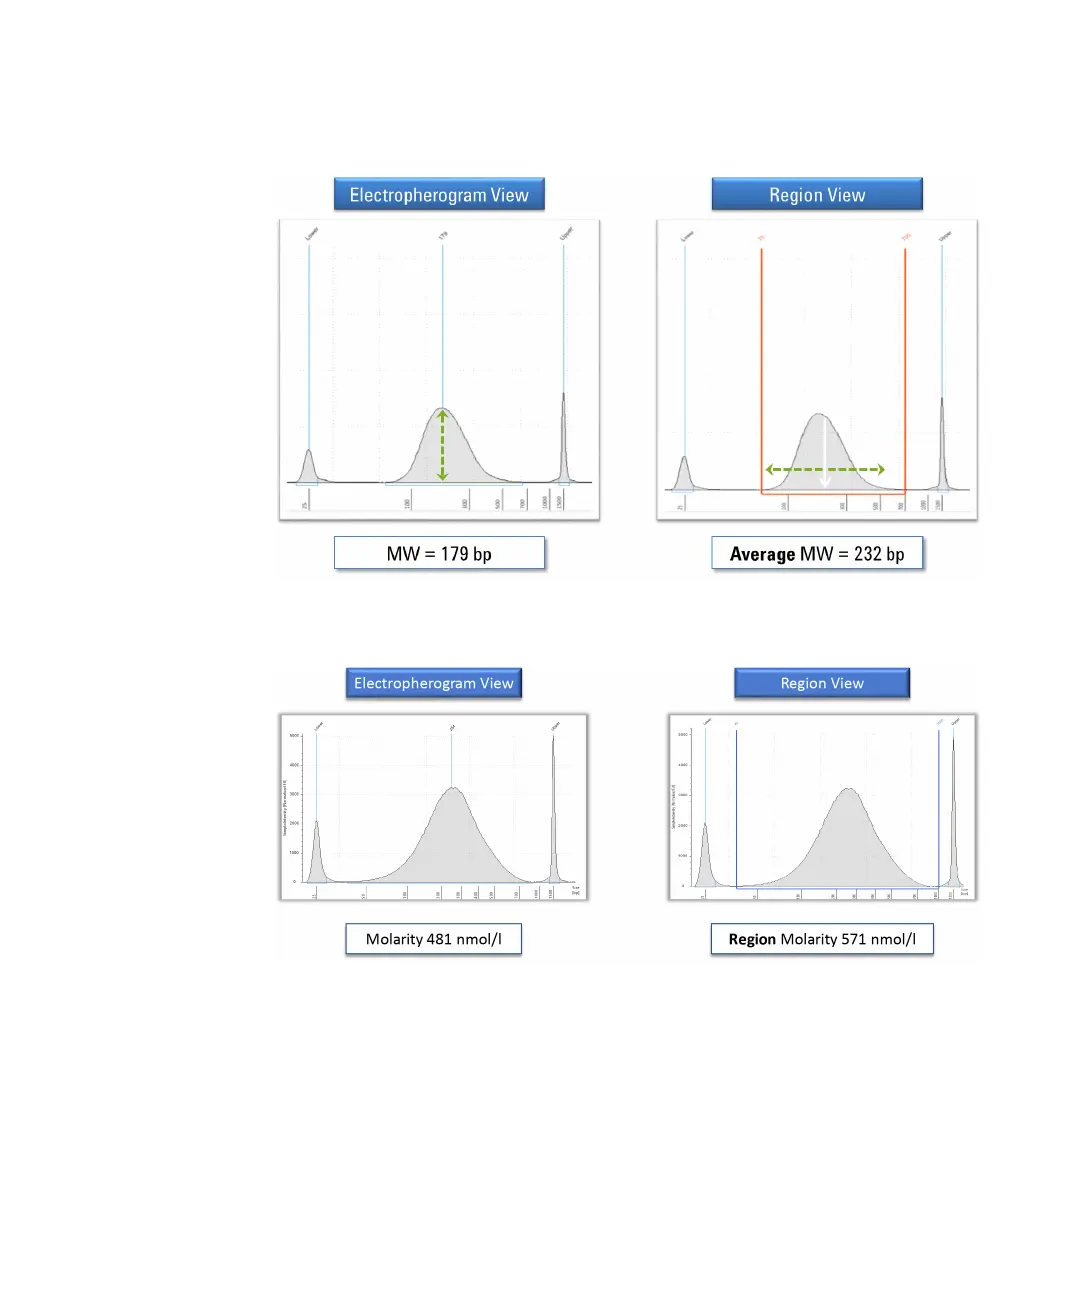
Peak Maxima Versus Average Molecular Weight Sizing and Molarity
Figure 30 The sizing data obtained in Electropherogram and Region views of the
TapeStation Analysis software.
Figure 31 The concentration data obtained in Electropherogram and Region views of
the TapeStation Analysis software.
 Loading...