Agilent 4150 TapeStation System Manual 109
Good Measurement Practices
7
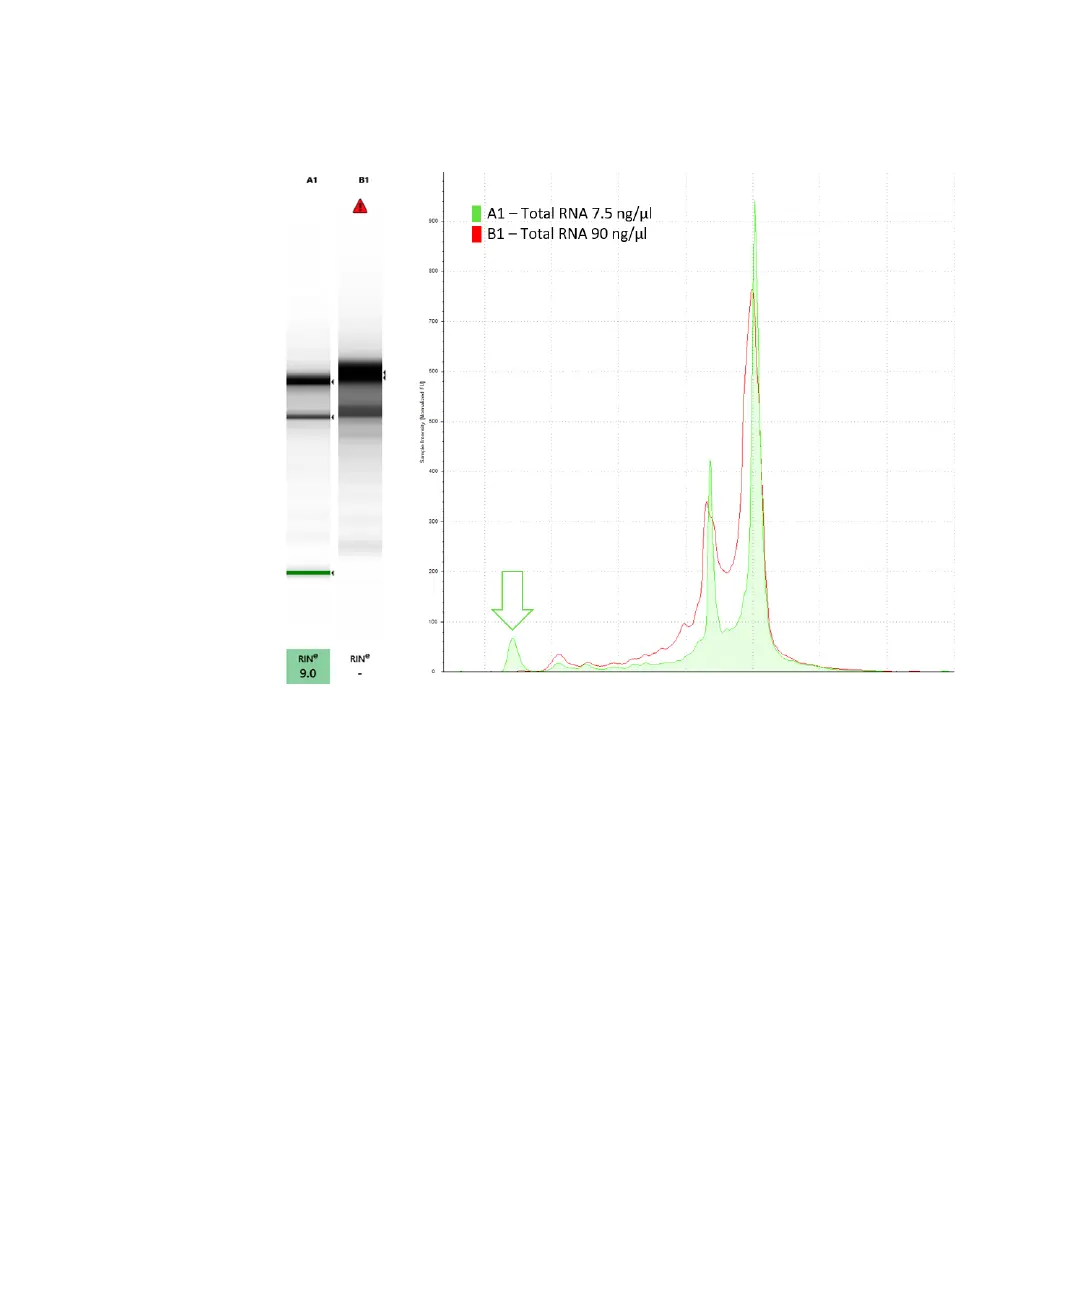
Quantitative range
Figure 36 Example of a sample within (A1) and outside (B1) the quantitative range of
the High Sensitivity RNA assay in the Gel view (Left) and Comparison view
(Right) of the TapeStation Analysis software. The Lower Marker peak (green
arrow) is missing in the overconcentrated sample.
 Loading...