Chapter 2 95
Making Measurements
Example 7: Stimulus-Response Measurements
Using Range Level versus Using Normalized Reference Level
The following example illustrates the difference between
RANGE LVL
and NORM REF LVL. The normalized frequency response of a
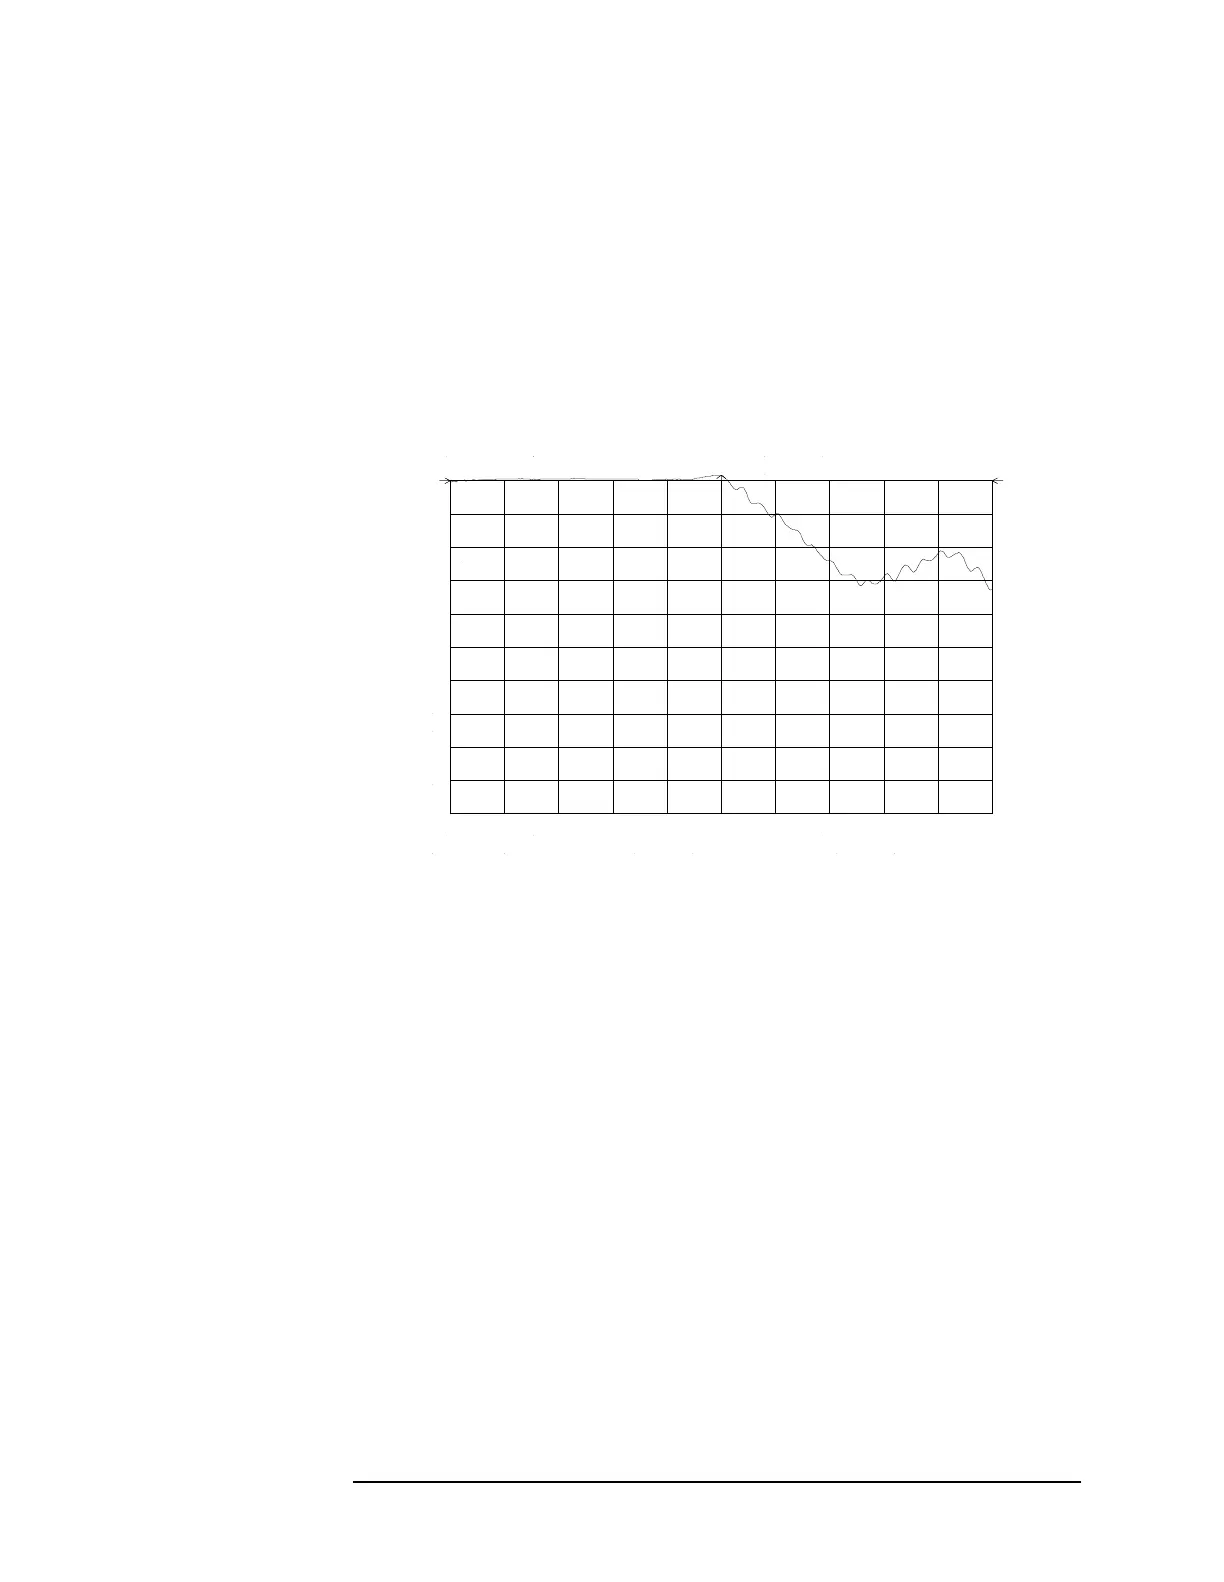
preamplifier is shown in Figure 2-41. The normalized trace is cut off at
the top of the graticule. This is confirmed by the step up
⇓ key when a
marker is activated, and the ERR 903 A>DLMT error message appears in
the error message block.
Figure 2-41 Normalized Frequency Response Trace of a Preamplifier
By increasing
NORM REF LVL to 30 dB, as shown in Figure 2-42, the
trace moves down on the screen. Note that (1) the input attenuator
value remains at 10 dB, (2) the marker-amplitude readout displays 13.2
dB, and (3) the ERR 903 A>DLMT error message is still displayed, even
though the signal appears to be fully within the graticule.
 Loading...
