P1 Patient Monitor User’s Manual
8-21
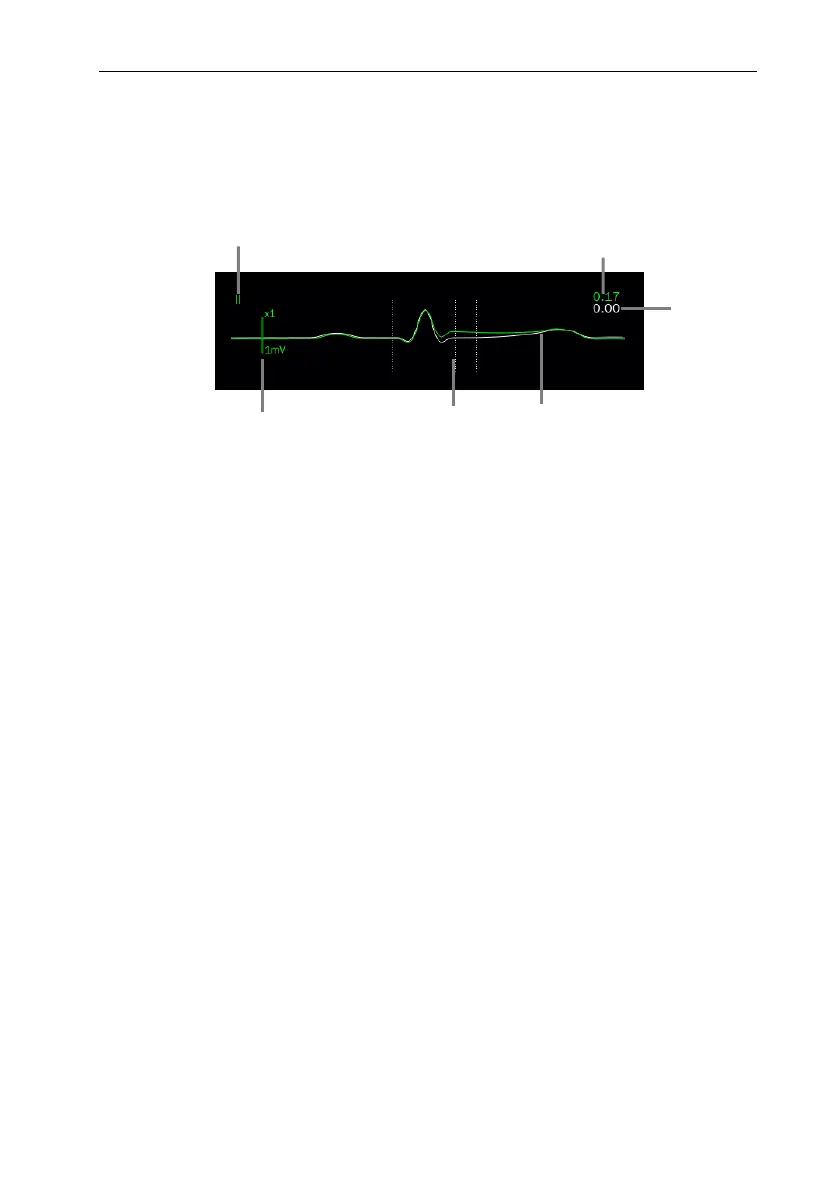
The ST waveform area displays the current ST segment waveform and baseline
waveform, the current ST value and baseline value. Generally, the current ST segment
and parameter values are displayed in green, while the baseline segment and parameter
values are displayed in white.
(1) ST lead
(2) The current ST value
(3) ST baseline value
(4) The current ST segment (green) and baseline ST segment (white)
(5) ST segment measurement position line
(6) Scale
8.7.5. Entering ST View
ST View displays a complete QRS segment of each ST lead. You can enter 【ST
View】 to view these ST segments. The color of the current ST segment and ST value is
the same as that of ECG waveform, usually green. ST baseline segment and baseline
value are white.
You can select the ST waveform area to enter the 【ST View】 page or enter the 【ST
View】 page through the following steps:
1. Select ECG parameter area, waveform area or ST parameter area to enter
【ECG】 menu.
2. Select 【ST】 submenu.
3. Select 【ST View】 from the bottom of the menu.
6 5
3
1
2
4
 Loading...