P1 Patient Monitor User’s Manual
6-10
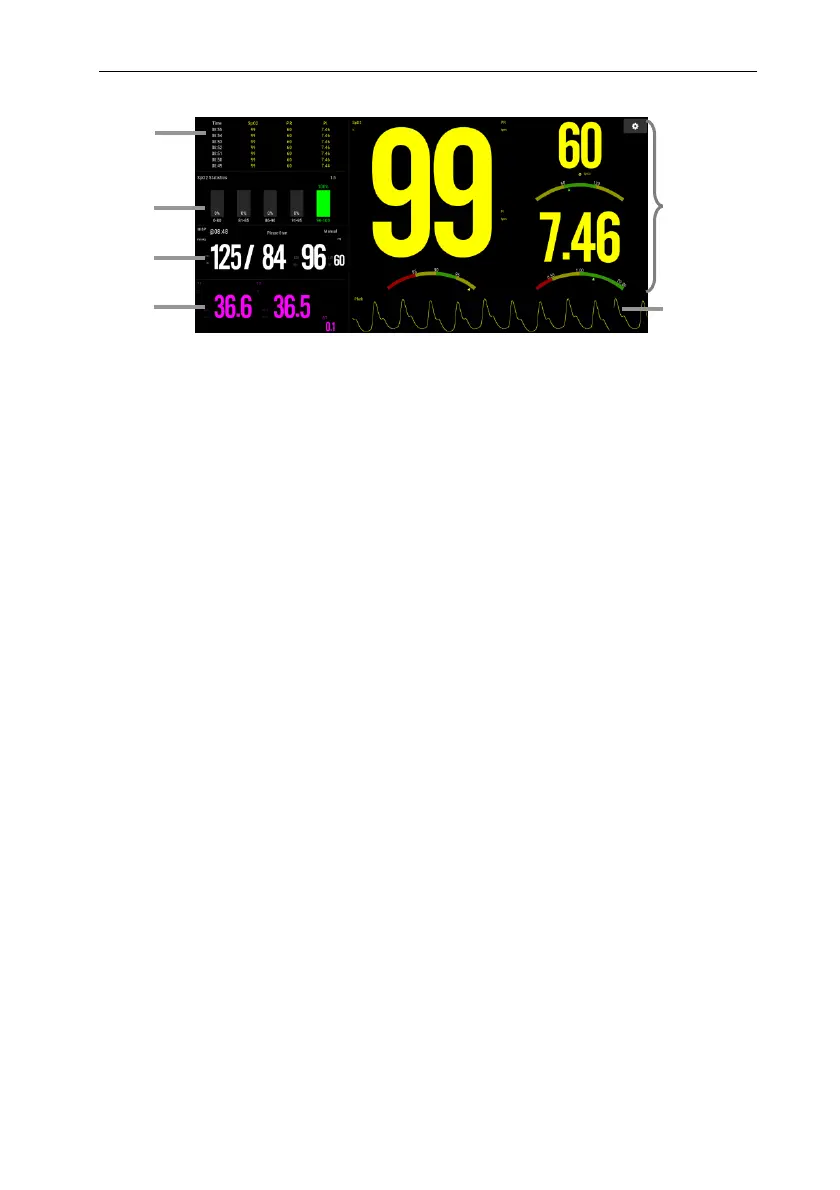
displayed on your monitor may be slightly different.
1. Trend Table: Display the trend of SpO
2
, PR, PI.
2. SpO
2
statistics area: Display SpO
2
segment statistics data.
3. NIBP parameter area: Display the measurement value and alarm limit of NIBP.
4. Temp parameter area: Display the measurement value and alarm limit of Temp.
5. SpO
2
parameter area: Display the measurement value and alarm limit of SpO
2
, PR
and PI. The dashboard displays information about the alarm limit. △ pointer
indicates the current measurement value.
6. Pleth waveform
6.7.3. SpO
2
Screen Operation
You can enter the parameter setting menu through the SpO
2
Screen. The operation
method is as follows:
Click SpO
2
statistical histogram to enter 【SpO
2
Statistics】 setup menu, set
SpO
2
segment result values and target segment.
Click the measurement values (SpO
2
and PI), the dashboard or Pleth
waveform to enter 【SpO
2
】 setup menu.
Click the measurement or the dashboard of PR to enter 【PR】 setup menu.
Click the measurement of Temp to enter the【TEMP】setup menu.
Click the measurement of NIBP to enter the【NIBP】setup menu.
6.7.4. Setting
You can select different SpO
2
module and Temp module, set the interval of trend
5
6
1
2
3
4