Math 92
• Press the Markers on Peaks softkey to set the markers on peaks, and press the Markers on harmonics softkey
to set the markers on harmonics.
• Press the Show Table softkey to show the amplitude of the markers; press the Show Frequency softkey to
show the frequency value of the markers, and press the Show Delta softkey to show the delta amplitude between
markers.
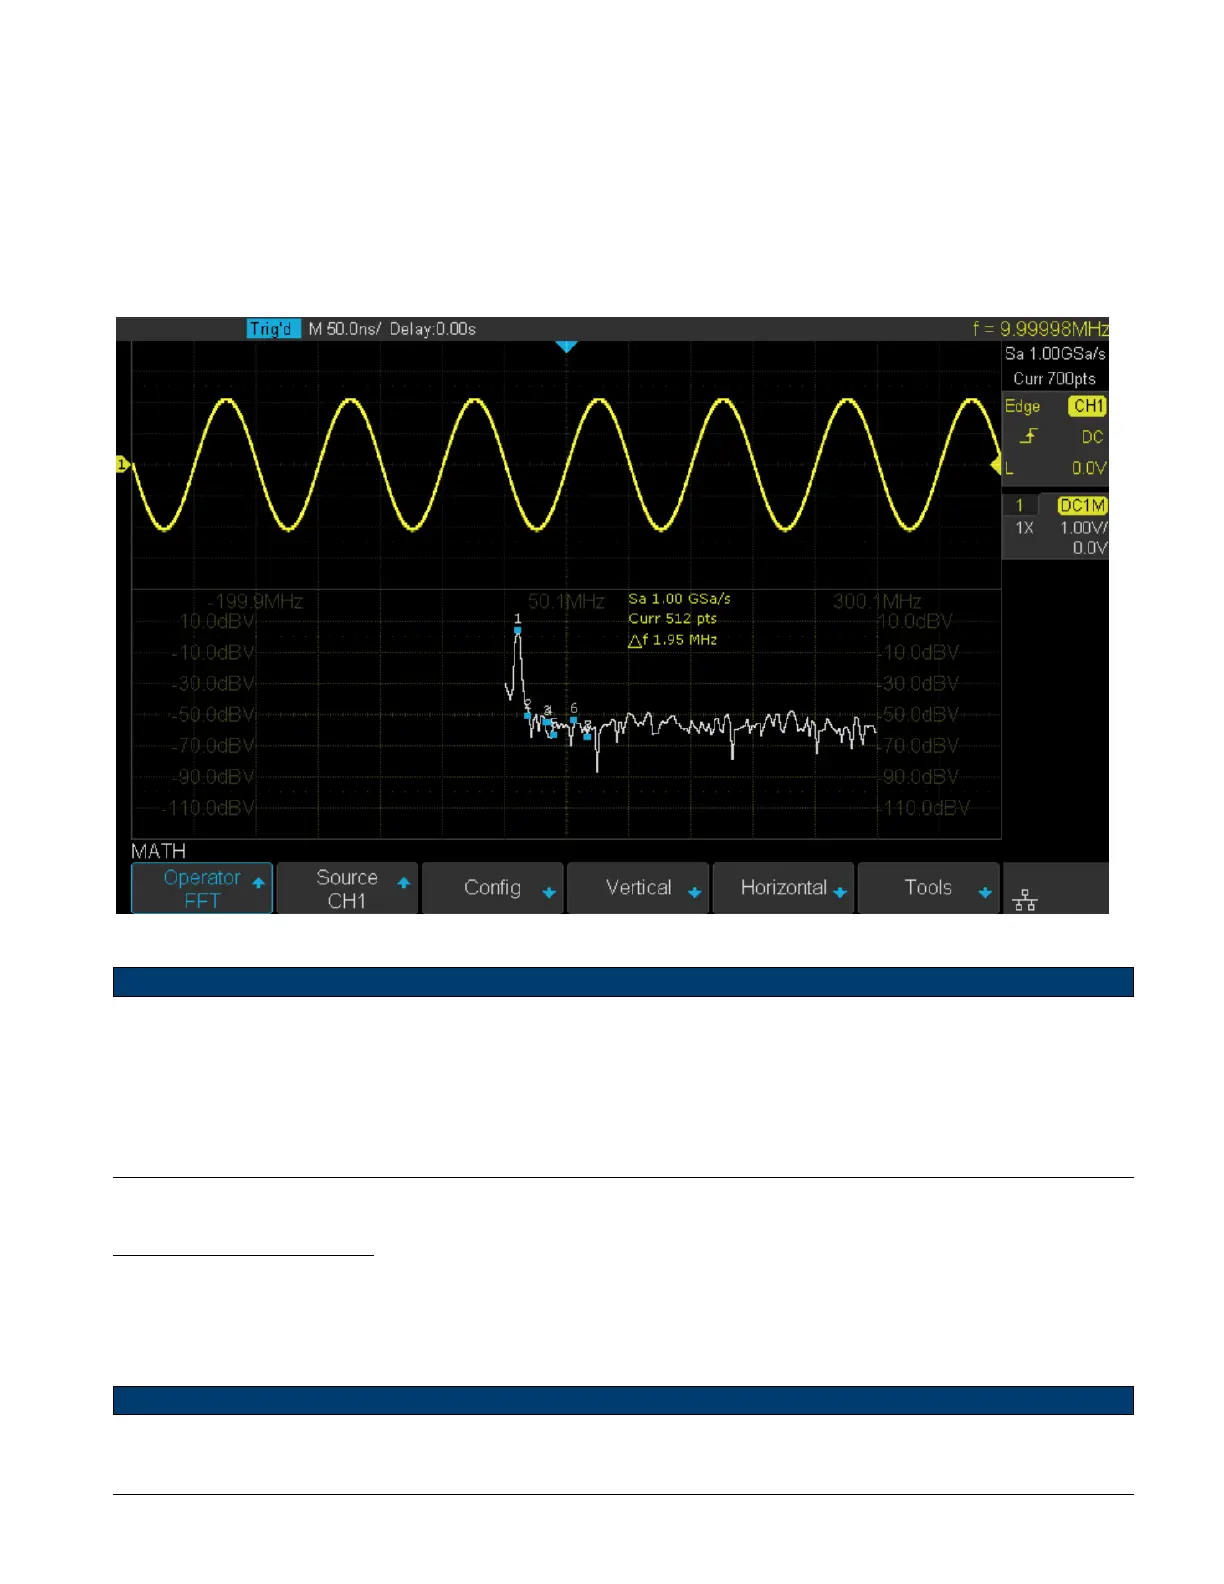
Figure 9.11 shows the FFT waveform displayed on the split screen and the peak tool is turned on:
Figure 9.11 FFT Waveform
Note:
• Signals with DC components or deviation would cause error or deviation of the FFT waveform components. To re-
duce the DC components, set the Channel Coupling to AC.
• To reduce the random noise and aliasing frequency components of repetitive or single pulse, set the Acquisition of
the oscilloscope to Average.
Measure FFT Waveform
To make cursor measurements, press the Cursors key, and then press the Mode softkey to select On to turn the cursors,
Use the X1 and X2 cursors to measure frequency values and the dierence between two frequency values (ΔX). Use the
Y1 and Y2 cursors to measure amplitude in dB and dierence in amplitude (ΔY). You can nd the frequency value at
the rst occurrence of the waveform maximum by using the X at Max Y measurement.
Note:
Refer to the Cursors section for a description on using cursors.