6-14
Trend Plot, continued
Trend plot
function keys
(continued)
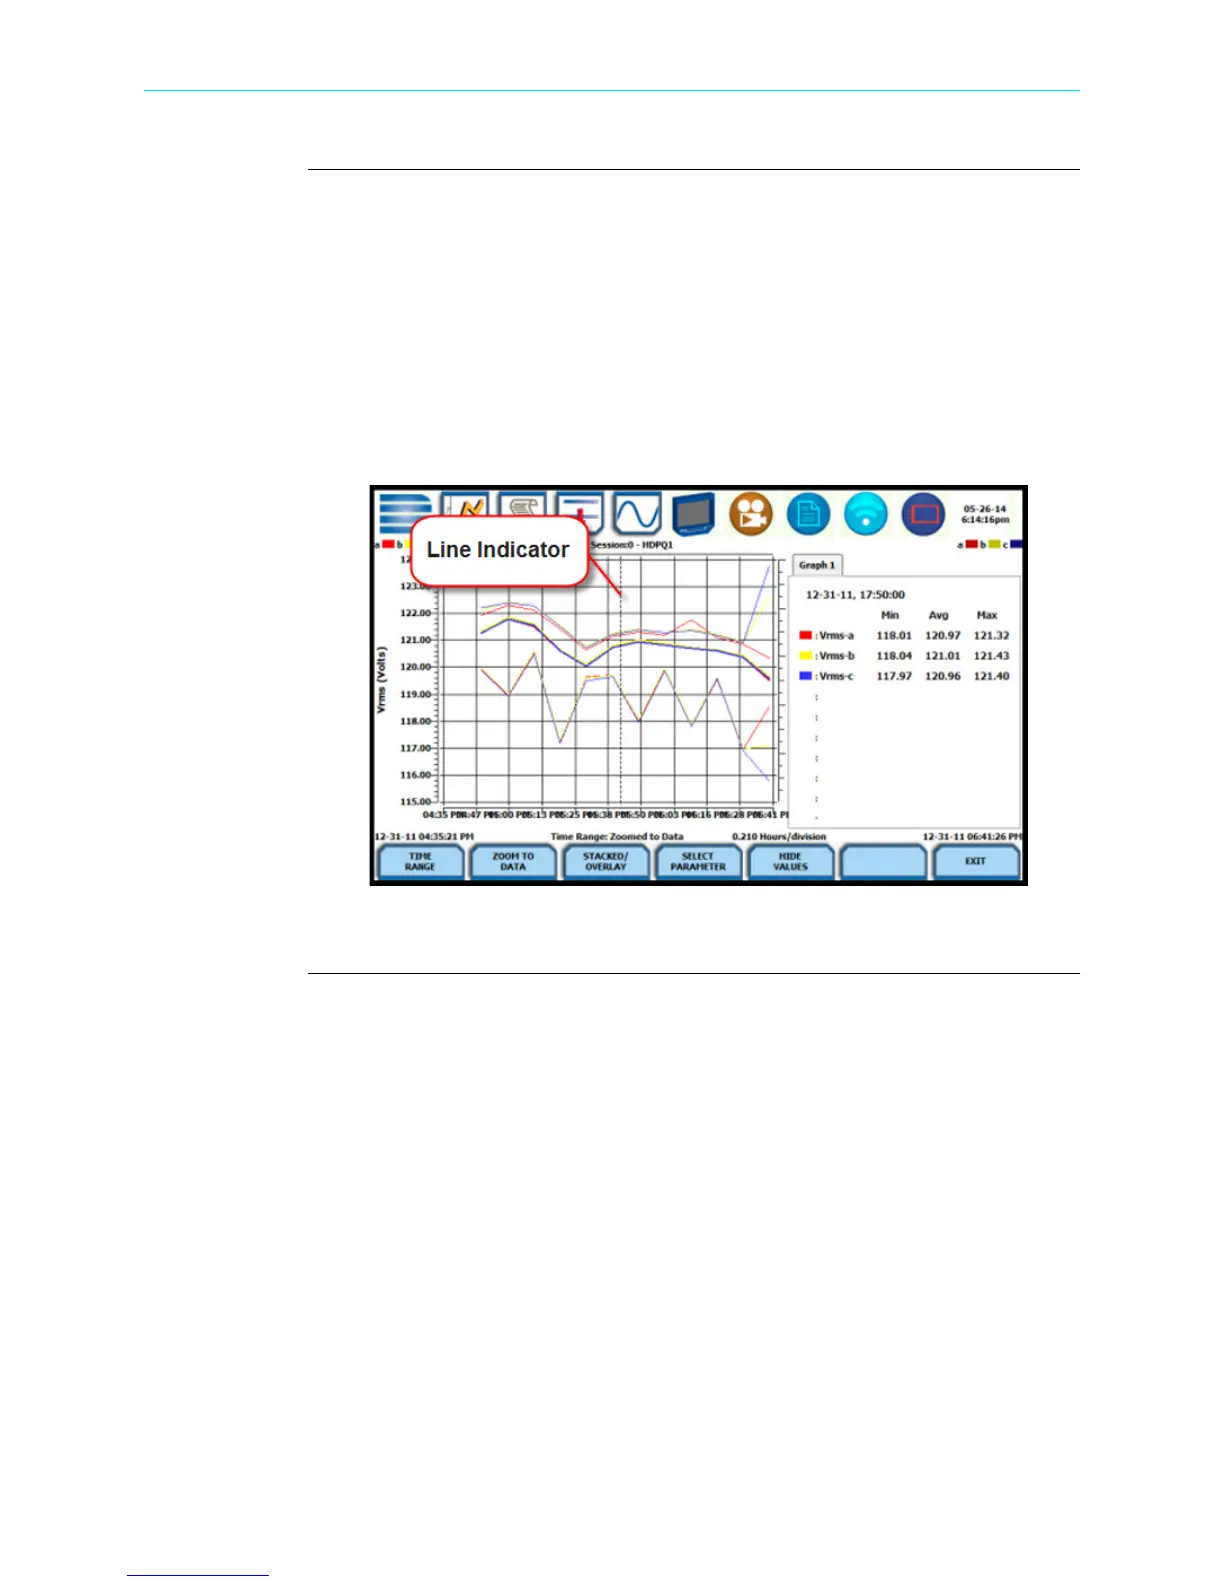
Show Values - splits the screen on the right pane to show values (min/avg/max) where
the vertical cursor line is displayed. The dotted vertical black line appears to indicate
the point where the numerical data values appear on the plot. You can touch and drag
the dotted cursor line onscreen and note how values on the right pane change to show
corresponding plot values. The time range based on which data is plotted appears
below the plot display.
The values are identifed by the color coded channel/parameter of captured events on
plot display. Pressing this soft function key repeatedly alternately toggles between
hiding/showing data values.
Press Exit to return to the Event Data & Reports menu.
HDPQ-610
Shop for Power Metering products online at:
1.877.766.5412
www.PowerMeterStore.com

 Loading...