3-22
Parameter Details in Dashboard Display
Parameter Details in Dashboard Display
Dashboard color
scheme
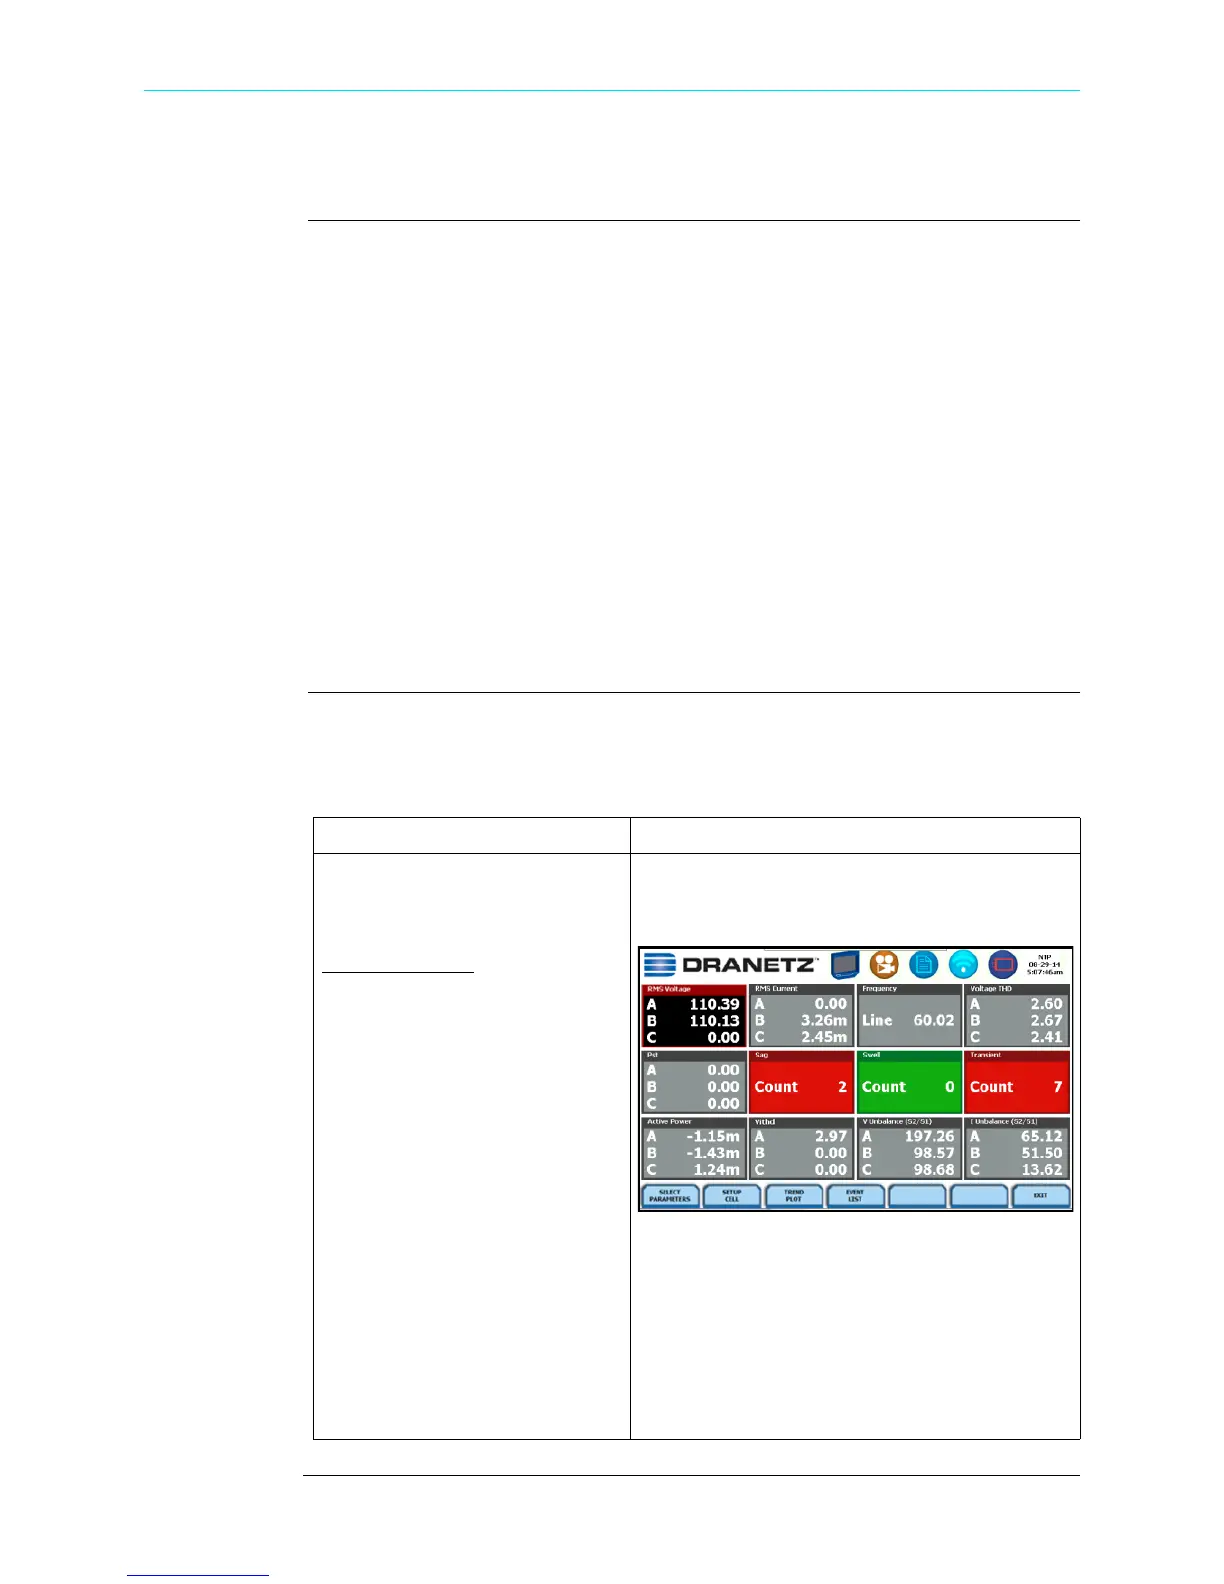
The dashboard displays metered data for the selected parameter. The metered data is
updated once per second. This is the same data that appears in the meter screen, and
used in calculating journals. If the selected parameter is not journalled, the rms event or
transient event count can be selected to appear in the dashboard instead of journalled
data.
Disabled parameters appear in gray. A dashboard display is considered disabled if none
of the limits were set. Also cells appear in gray when not monitoring.
Enabled parameters, on the other hand, are color-coded. A dashboard is active while
the instrument is monitoring or by loading a previously saved file from memory. An
active dashboard can have two or three states (Normal, Moderate, or Severe). When
monitoring, parameters that are within limits are shown in green (indicates Normal
state). Those that are moderately out of limits, exceeding Low or High threshold limits,
are shown in yellow (indicates Moderate state). Parameters that are extremely out of
limits, exceeding Very Low or Very High threshold limits, can be shown in blinking red
(indicates Severe state) if this function is turned on.
Parameter
details
The following procedure describes how to view parameter details in the dashboard
display. Note that the same procedure applies even when you select different journal
categories to plot.
Action... Result...
STEP 1: Select a cell from the
dashboard to display the soft keys
to edit cell parameters.
FOR EXAMPLE
:
In the PQ panel, select RMS
Voltage. Four soft keys to edit/
view cell parameters appear.
• To view/modify the parameter
and channel/s displayed on
screen, press Select
Parameters. Go to Step 2.
• To set the cell property name,
parameter threshold limits and
turn on/off the blink function,
press Setup Cell. Go to Step 3.
• To view plots of journalled data
over time, press Trend Plot.
Go to Chapter 6.
• To view the list of captured
events, press Event List. Go to
Chapter 6.
HDPQ-318b
Shop for Power Metering products online at:
1.877.766.5412
www.PowerMeterStore.com

 Loading...