6-15
CH 6/ View Event Data & Reports
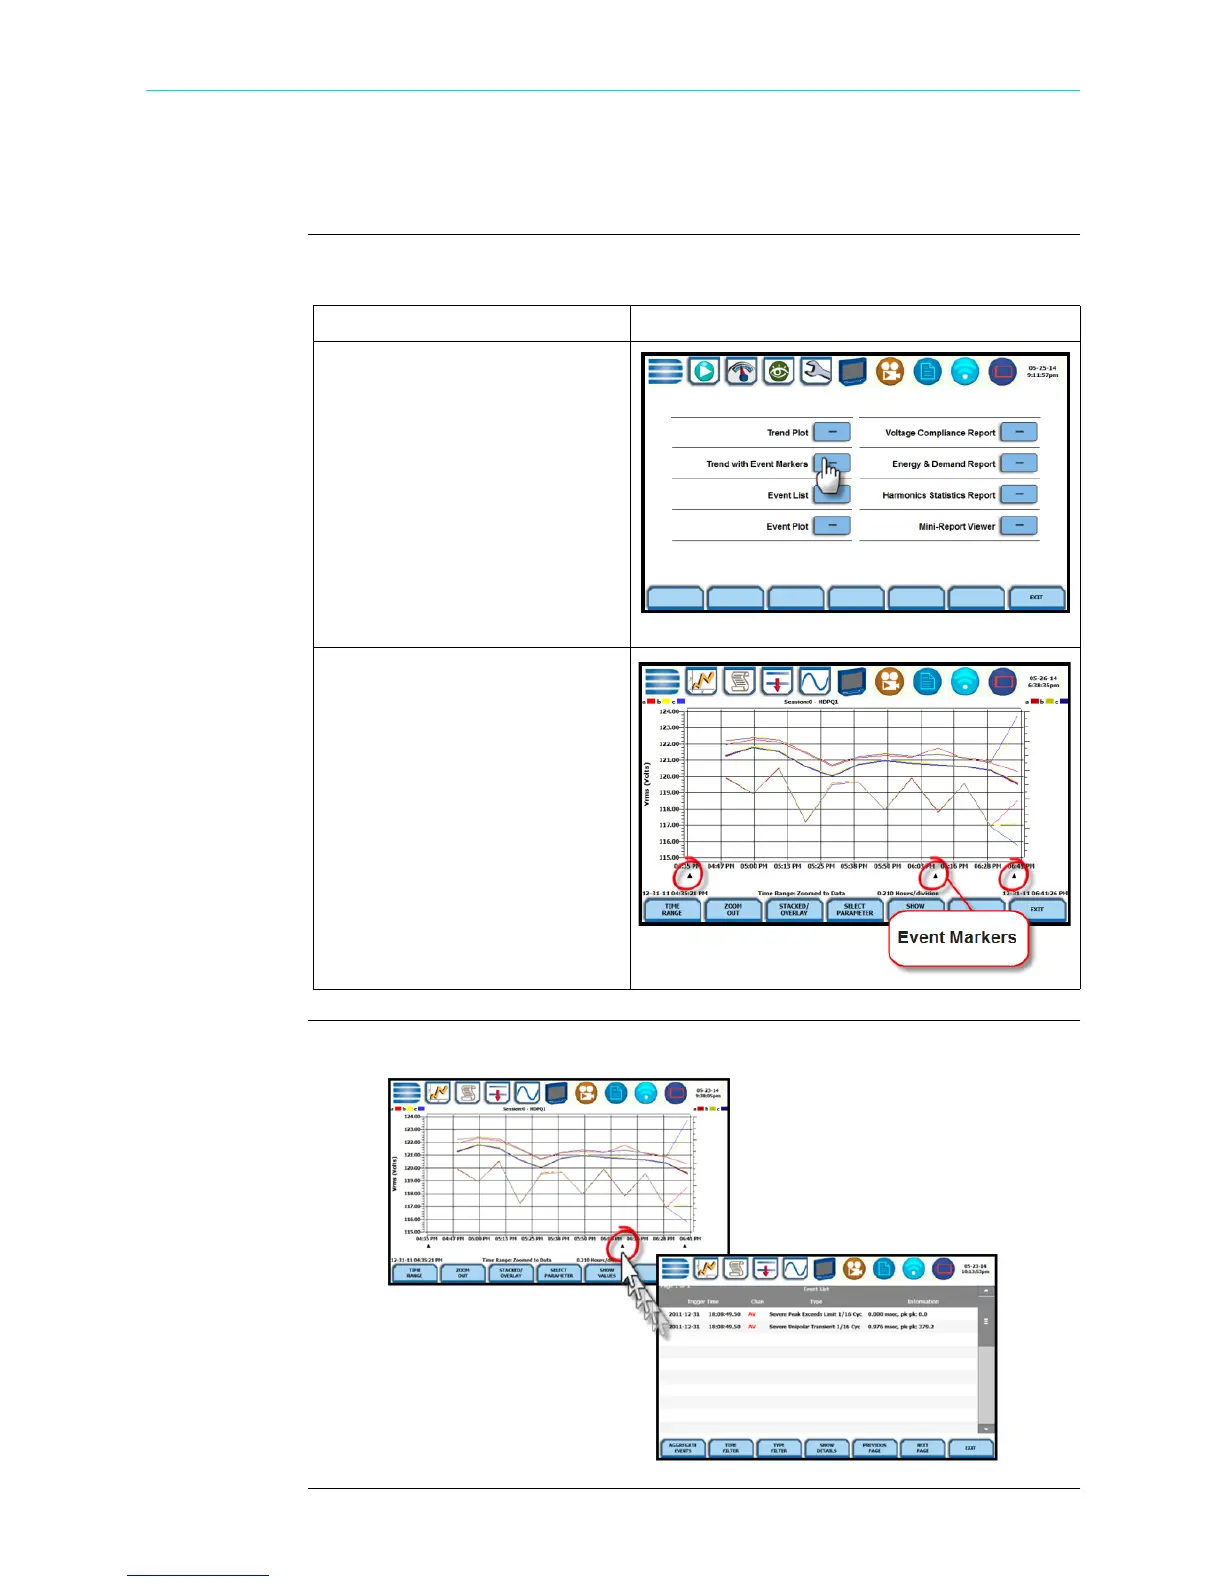
Trend Plot with Event Markers
View trend with
event markers
Event markers appear on the time axis where there are events.
Event markers
Clicking on an event marker allows you to view the event list details.
Action... Result...
STEP 1: From the Event Data &
Reports menu, press Trend with
Event Markers. Proceed to Step
2.
STEP 2: On Trend with Event
Markers, events are marked on
the horizontal axis so they are
easily identified. The area under
the time scale where event
markers are is an active area.
Pressing along this strip allows
you to view the event list near the
time range of the event. From the
Event List screen you can then
select and view details about that
event. See sample image below.
HDPQ-601
HDPQ-611
HDPQ-612
Shop for Power Metering products online at:
1.877.766.5412
www.PowerMeterStore.com
 Loading...