6-17
CH 6/ View Event Data & Reports
Section B
Events
Overview
What is
displayed on
event screen?
The event screen displays actual voltage or current rms and/or waveforms that occurred
when a certain threshold parameter was crossed. Time plots, event list, rms and
waveform displays are visually interfaced showing event patterns and behaviors over
threshold limits and time. The event screen allows you to customize data plots, change
and/or add parameters/channels to plot. You can select the number of rms and
waveform cycles to view, as well as display threshold values and event details.
NOTE: Event data becomes available only after monitoring has been turned on or upon
reading a file from memory.
In this section
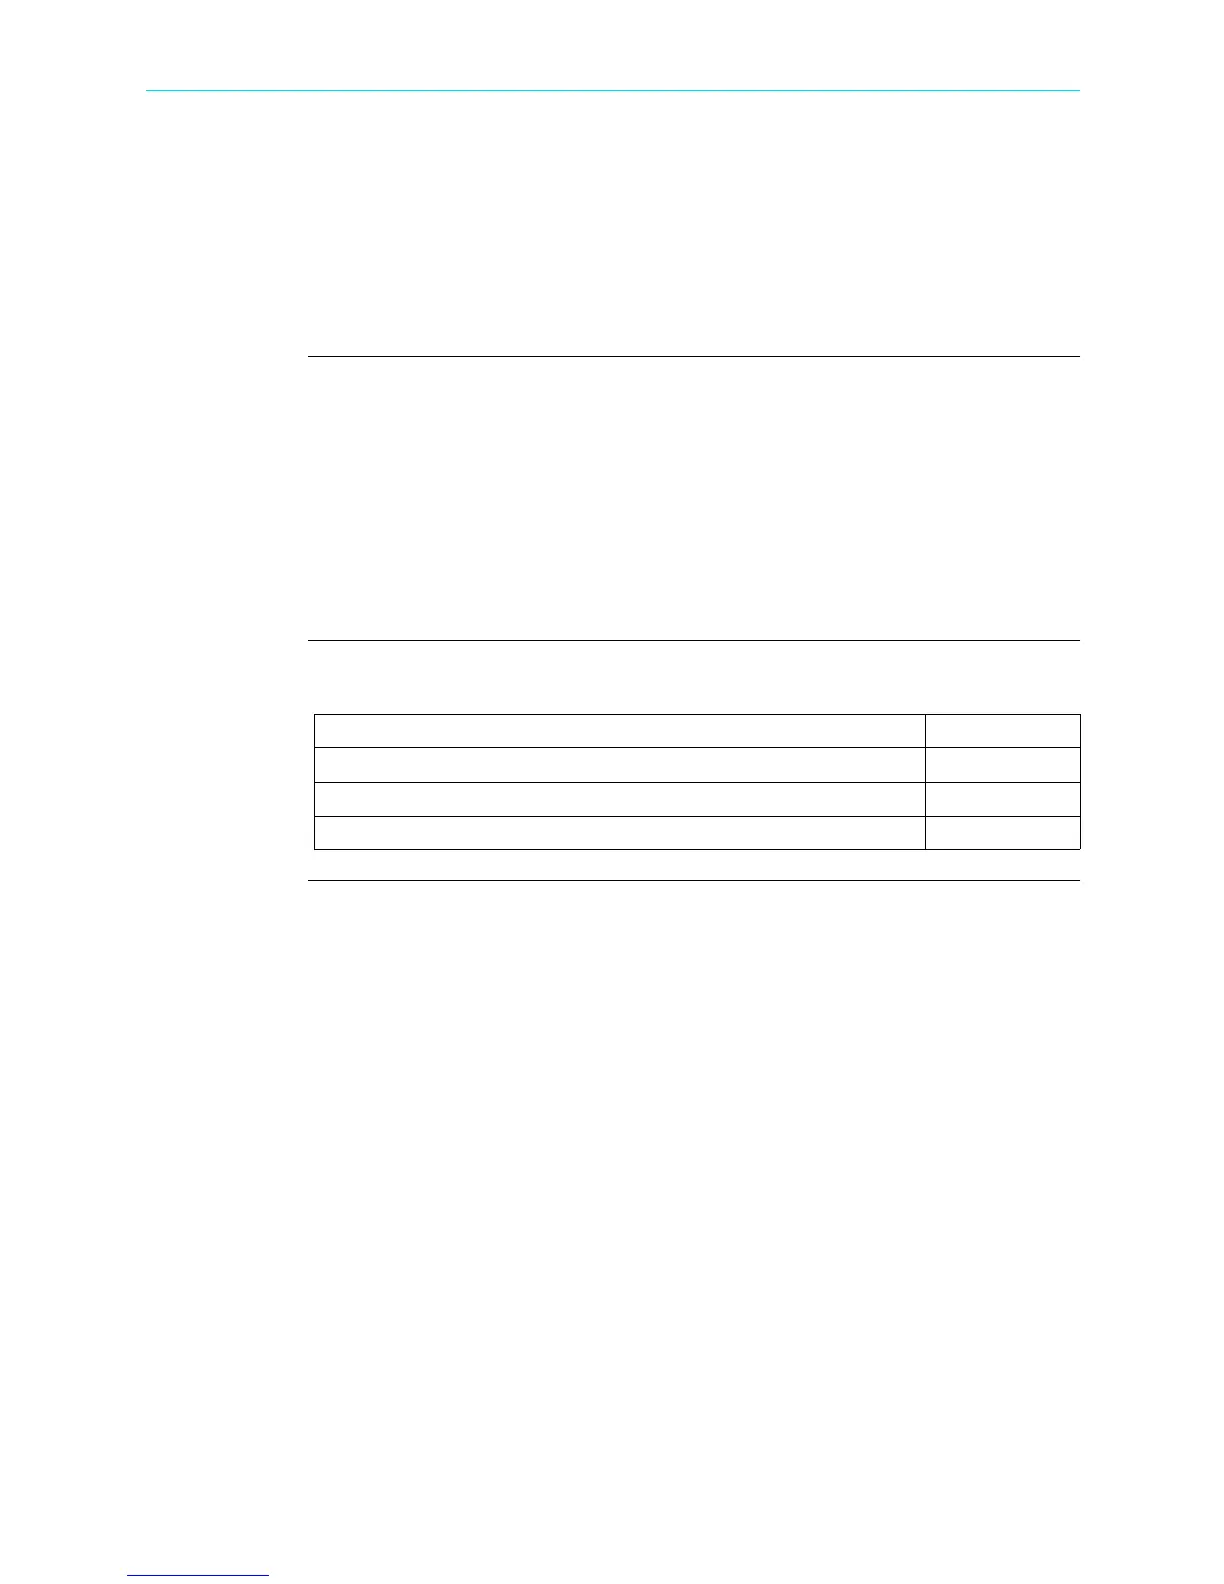
The following topics are covered in this section.
Topic See Page
Event List 6-18
Event Plot - RMS 6-22
Event Waveform 6-28
Shop for Power Metering products online at:
1.877.766.5412
www.PowerMeterStore.com

 Loading...