6-49
CH 6/ View Event Data & Reports
Energy & Demand Report
Energy &
Demand report
interface
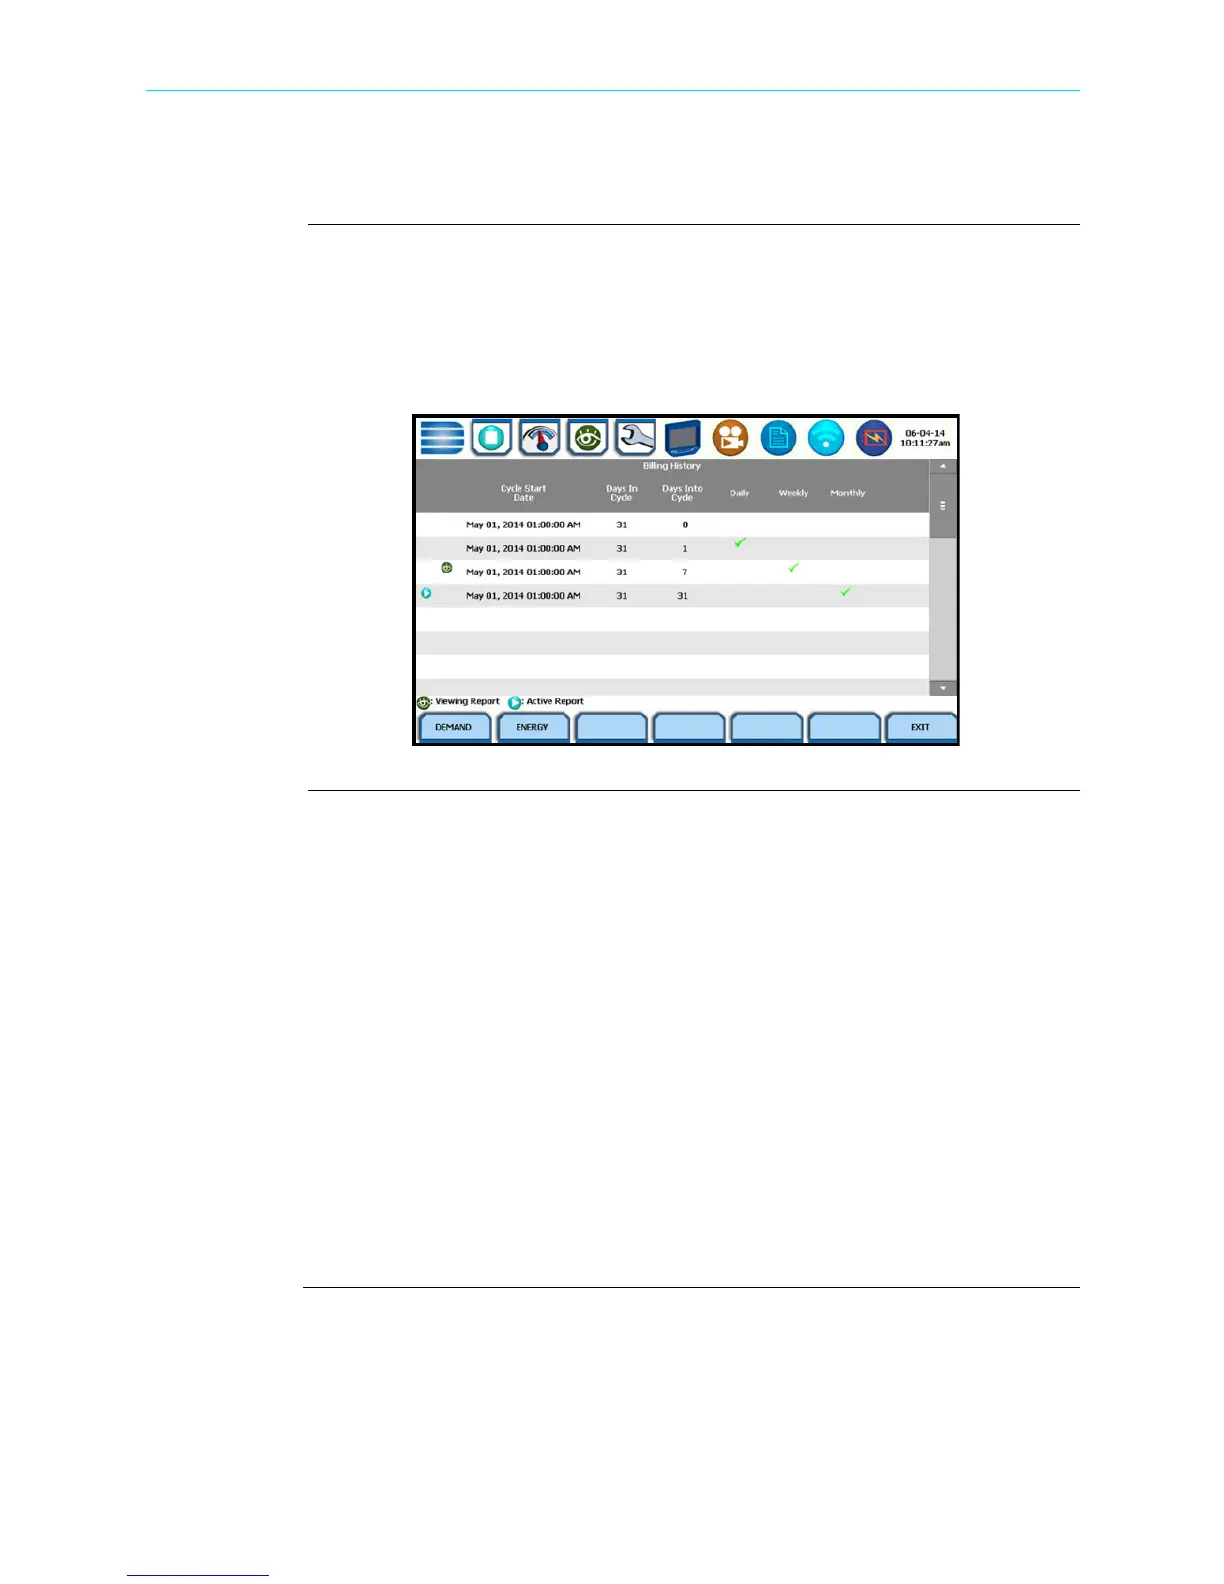
HDPQ Xplorer gives you the option to view the demand and energy report. The report
list, as shown below, helps you monitor and manage energy consumption including
utility costs. The instrument lists the report data files (.ddb), arranged in the order of
date and time they were recorded
From the Event Data & Reports menu, press Energy & Demand Report.
Use the function keys at the bottom of the screen to select Demand or Energy report for
viewing. Each report entry is identified by a general heading indicating the following:
Cycle Start Date - specifies the date and time of the beginning of the billing interval
cycle.
Days In Cycle - refers to the specific number of days that make up a billing cycle.
For example, the number of days in cycle typically range from 25 to 31 days, after
which a new billing cycle begins.
Days Into Cycle - refers to the number of days of recorded usage from the cycle start
date. This number is calculated into your billing rate to date (prior to the end of the
billing cycle).
For example, suppose a billing cycle starts on the 1st of the month and ends on the 31st
of the month. On the 10th calendar date, you are 10 days into a 31-day billing cycle.
HDPQ-662
Shop for Power Metering products online at:
1.877.766.5412
www.PowerMeterStore.com

 Loading...