3-32
Harmonic Graph/Table
Harmonic Graph/Table
Harmonic
graph/table
display
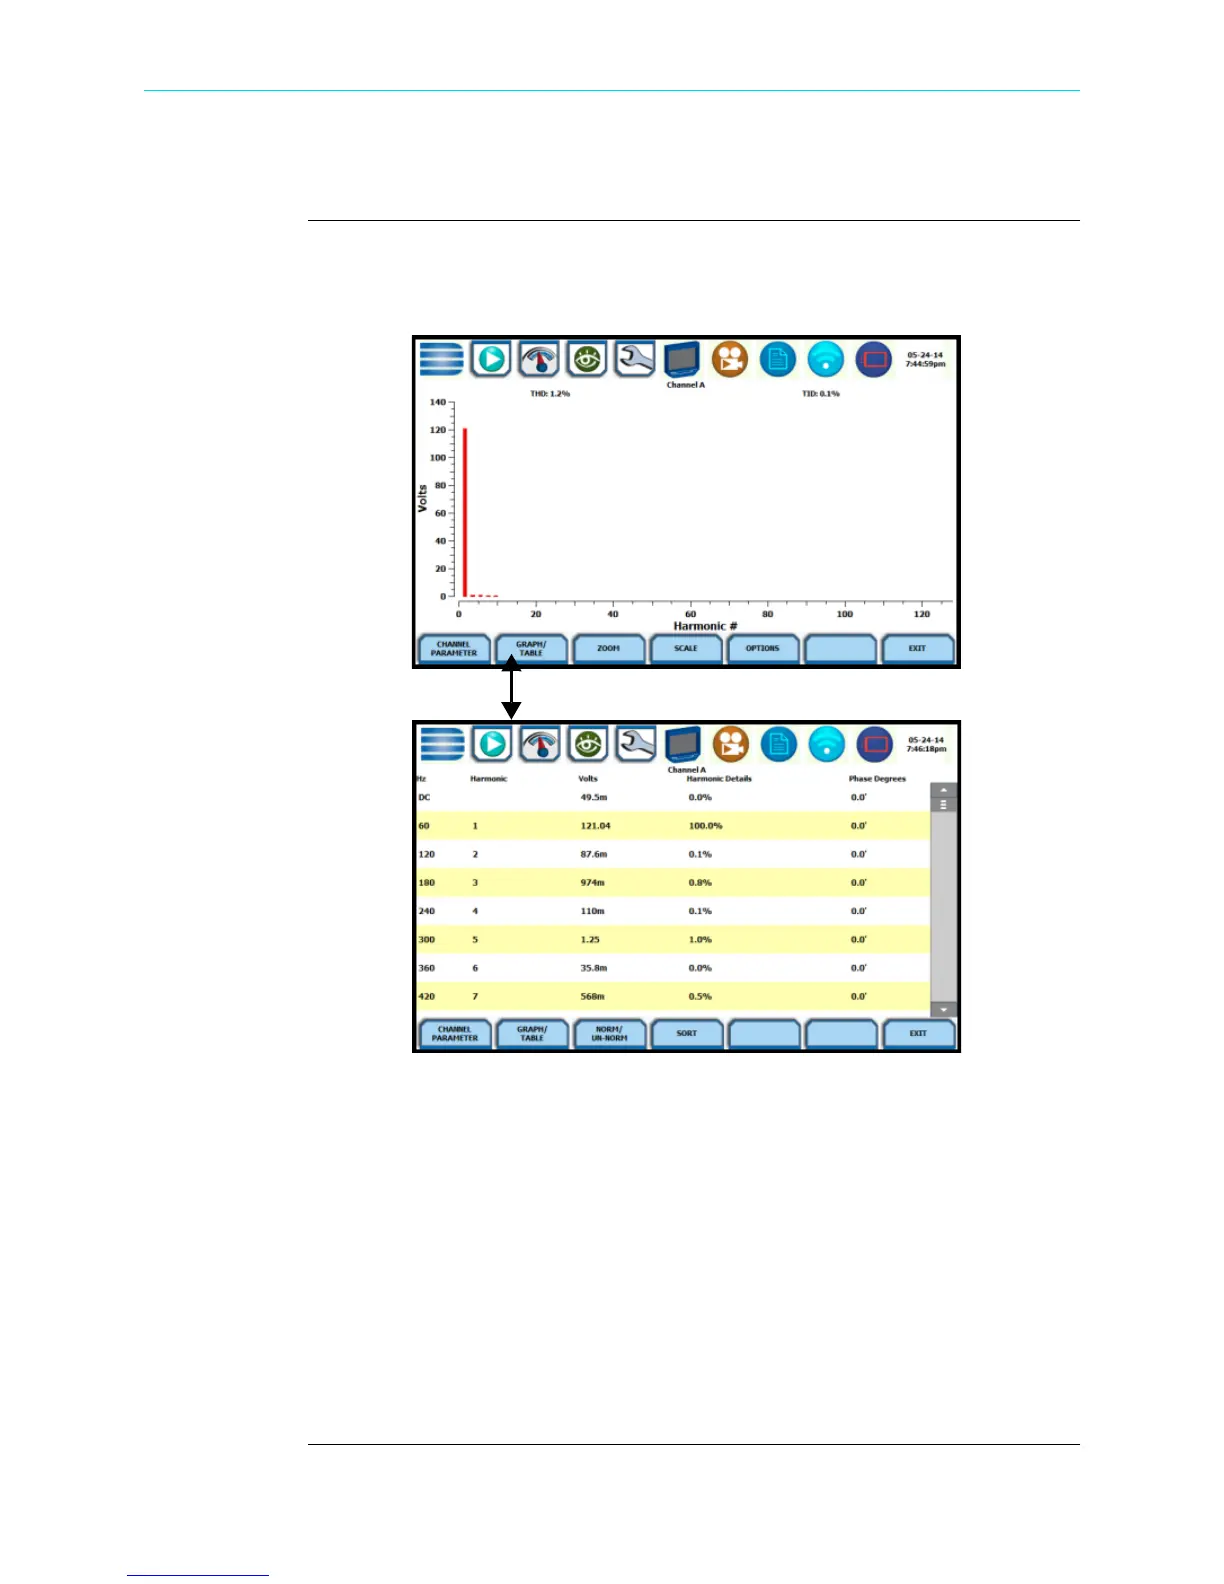
The Graph/Table function key toggles between spectrum graph to table of magnitude
and phase in text form. Use this key if you want to switch views between harmonic
graph to harmonic magnitude table, as shown below.
The harmonic parameters displayed on list include: (from leftmost column) the
harmonic/interharmonic frequency in Hz, frequency in number, voltage rms or
maximum load of current (depending on parameter selected), percent amplitude of
harmonics, and harmonic phase angle value.
By default, harmonic and interharmonic frequency values are arranged in order of
increasing frequency. Use the Sort button to organize harmonic text display in order of
decreasing magnitude. The harmonic values are shown in boldface.
*The odd contribution is the square root of the sum of the squares of the relative
amplitudes of harmonics 3, 5, and 7 through N-1, where N is a function of sampling
frequency. The even contribution is similar for harmonics 2, 4, and 6 through N. Total
value is the square root of the sum of the squares of the odd and even distortions.
HDPQ-328
HDPQ-329
Shop for Power Metering products online at:
1.877.766.5412
www.PowerMeterStore.com

 Loading...