6-42
Compliance Summary, continued
Voltage
compliance
measurement
parameters
(continued)
Interharmonic Voltage
: Interharmonic displays a cluster of bars, one for each phase.
The color of each bar indicates the compliance status that is calculated by adding the
status of Total Interharmonic Distortion (TID) and Interharmonics 2 thru 25. The dotted
red line indicates the trigger timestamp or start of event.
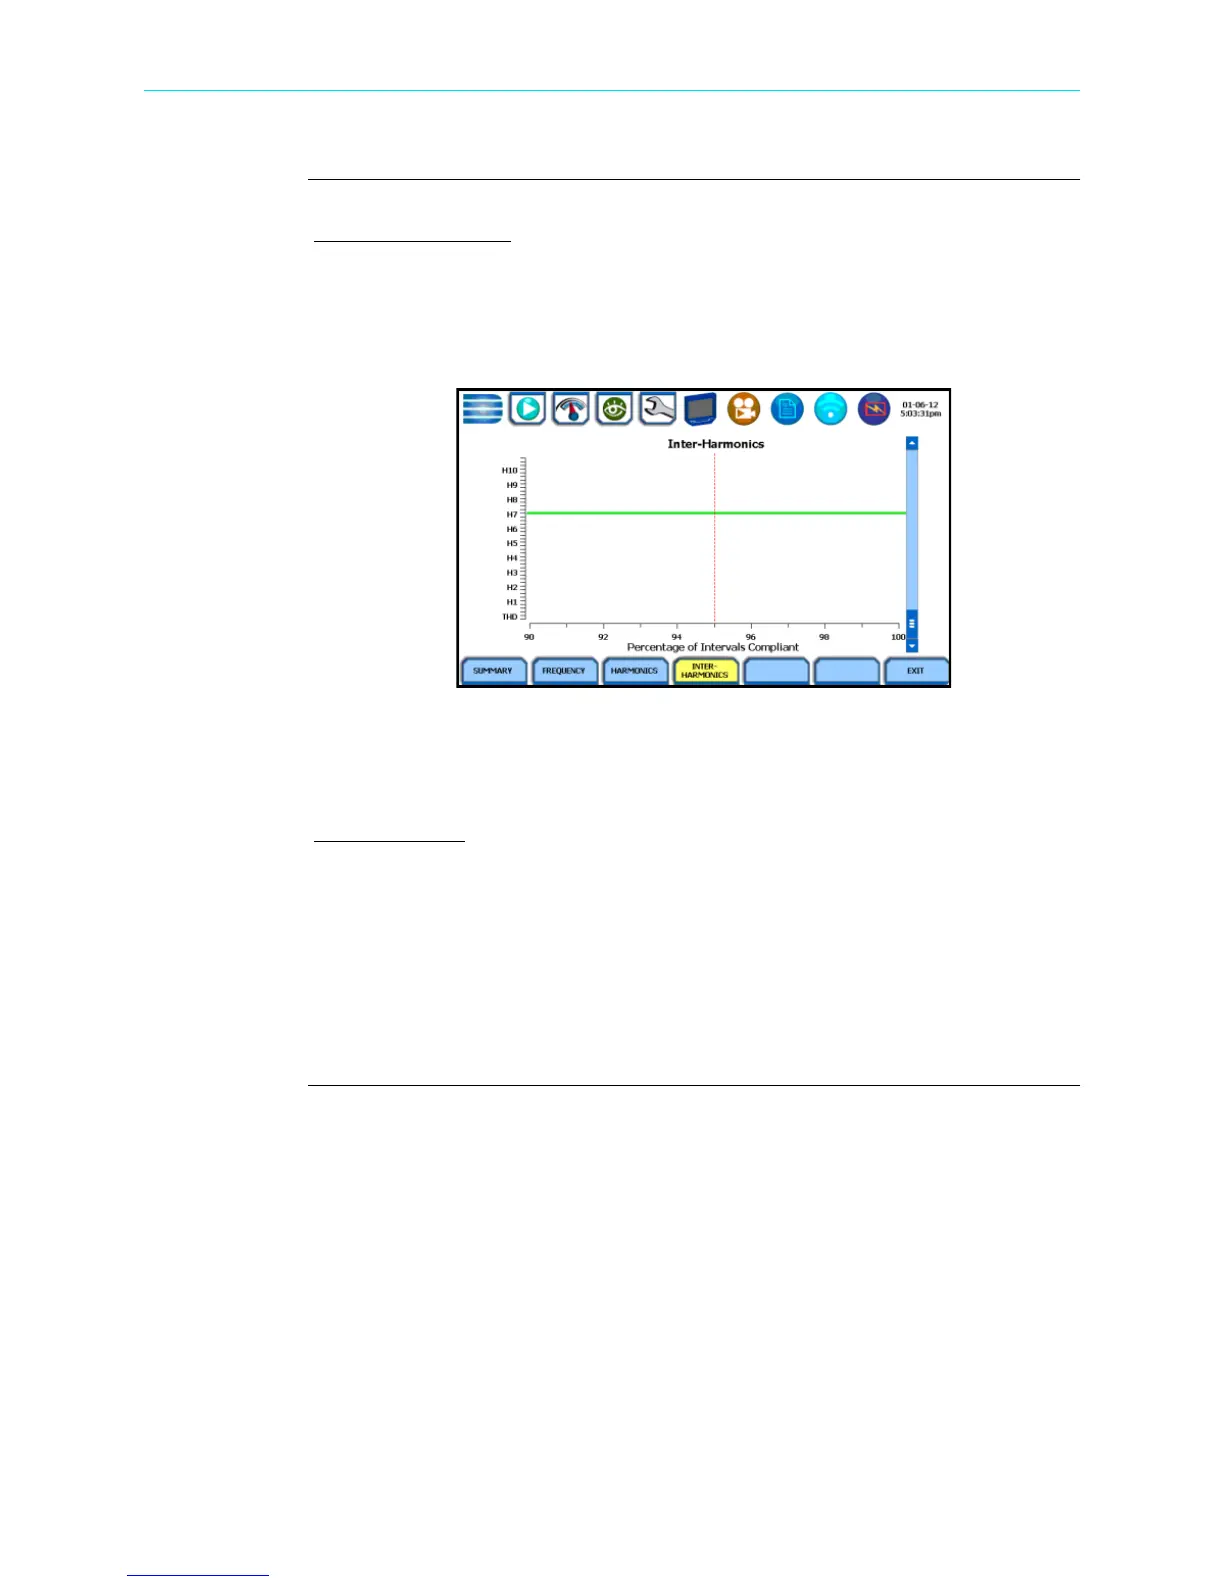
Press the Interharmonics key to display the interharmonic graph, sample screen below.
The interharmonic graph displays the status of each individual Interharmonic and TID
for each phase. The bar chart indicates the percentage of intervals passing the specified
compliance.
Mains Signalling
: Mains Signalling is represented by a single value and a single bar.
The color of the bar indicates compliance status that is calculated by adding the status
of each of the defined frequencies (a maximum of five) for its phase. A green bar
indicates that the parameter is within compliance. A red bar indicates that the parameter
does not comply with QOS limits.
NOTE: You can specify the signalling frequency values when configuring setup
paramters under Monitor Mode > Voltage Compliance (EN50160), see Chapter 4 Setup
Monitoring.
HDPQ-652c
Shop for Power Metering products online at:
1.877.766.5412
www.PowerMeterStore.com

 Loading...