2.2 Screen Names and Configurations
28
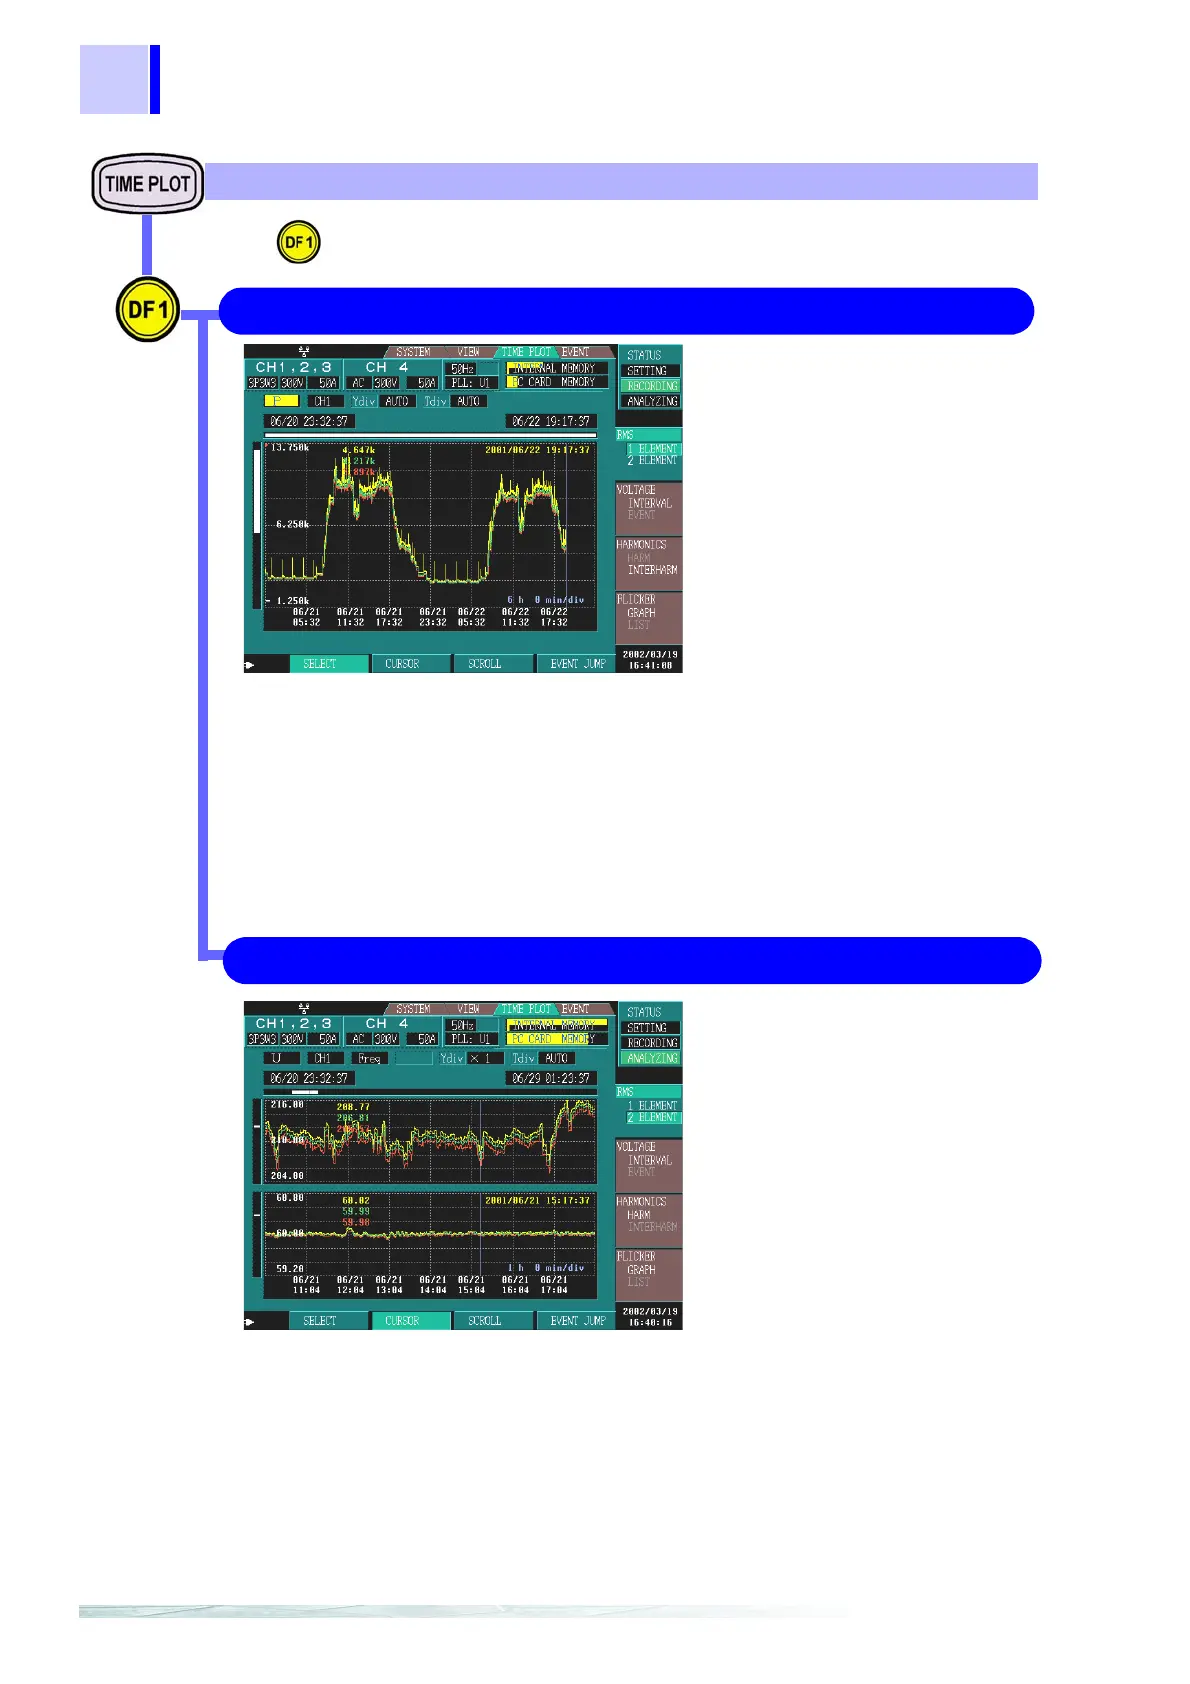
You can display the fluctuation graph
of a single RMS value selected from
the following.
• Frequency
• Voltage
• Voltage waveform peak
• Current
• Current waveform peak
• Active power
• Apparent power
• Reactive power
• Power factor
•K factor
• Voltage unbalance factor
• Current unbalance factor
• Harmonic voltage distortion factor
• Harmonic current distortion factor
RMS values are calculated
*1
in the
3196 at 200 ms intervals without gaps.
The maximum, average, and mini-
mum values are detected using the
multiple 200 ms interval RMS values
included in the set interval, and the
display changes.
1 ELEMENT 6.3 "Changes in RMS Value"(page 89)
2 ELEMENT 6.3 "Changes in RMS Value"(page 89)
Press to switch the display screen.
RMS TIME PLOT Screen
*1: Calculated without gaps.Continuous RMS value
calculations at
200 ms intervals (50 Hz: 10 waveforms, 60 Hz: 12
waveforms, 400 Hz: 80 waveforms).
You can display a fluctuation graph fo
two RMS values selected from the fol
lowing.
• Frequency
• Voltage
• Voltage waveform peak
• Current
• Current waveform peak
•Active power
• Apparent power
• Reactive power
• Power factor
• K factor
• Voltage unbalance factor
• Current unbalance factor
• Harmonic voltage distortion factor
• Harmonic current distortion factor
RMS values are calculated
*1
in the
3196 at 200 ms intervals without any
gaps.
The maximum, average, and minimum
values are detected from the multiple
200 ms interval RMS values included i
the set interval, and the display chang
es.