2.2 Screen Names and Configurations
29
Displays a voltage fluctuation graph
used to calculate the swell, dip, and in
terruption.
Voltage is calculated for one waveform
shifted over half a wave.
The maximum and minimum values
are detected from the multiple voltage
values included in the set interval, and
the display changes.
You can also display S(t) (when IEC
flicker is selected) or ΔU (when DV10
flicker is selected), either of which indi
cates the voltage deviation with re-
spect to nominal voltage.
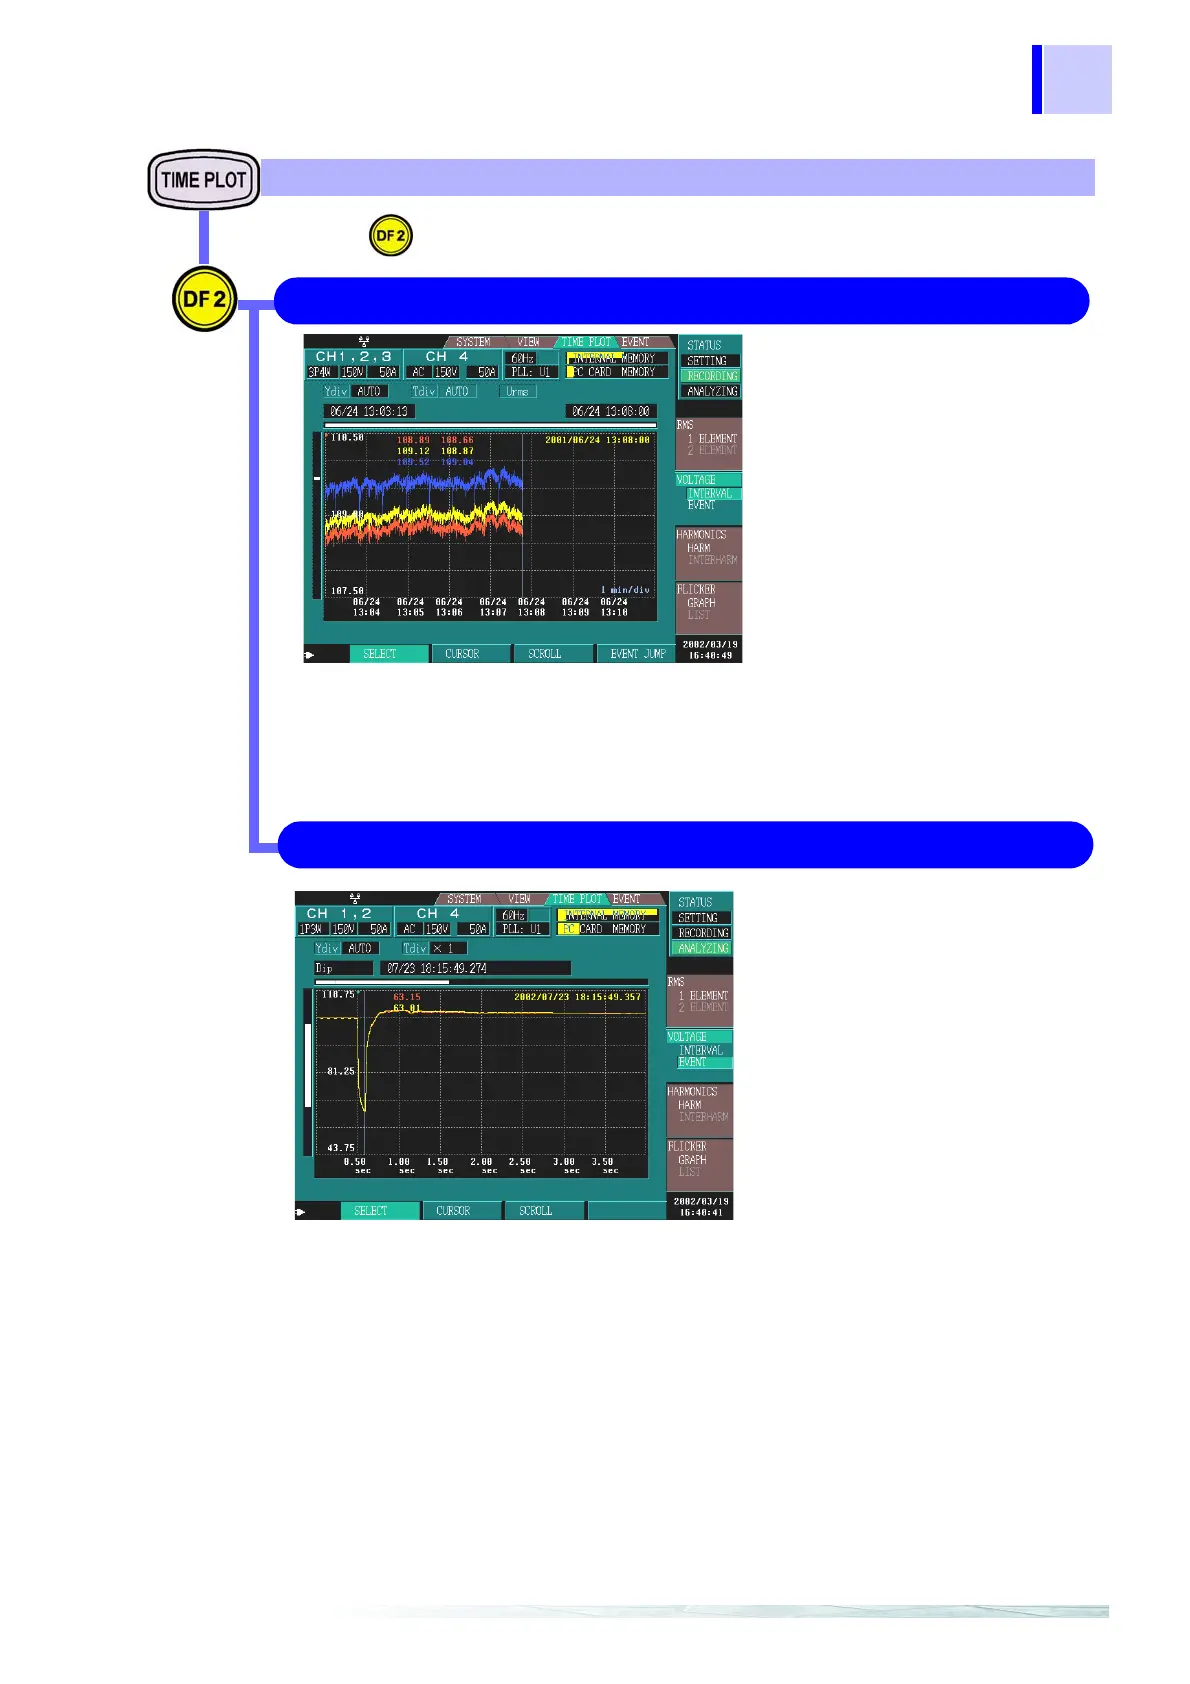
INTERVAL 6.4 "Changes in Voltage"(page 93)
VOLTAGE TIME PLOT Screen
Press to switch the display screen.
EVENT 6.4.2 "Graphing Voltage Fluctuations for Events"(page 96)
Displays the voltage fluctuation graph
for a voltage swell, dip, or interruption
event.
The result of calculation for a single
half cycle-shifted waveform is dis-
played without alteration as a voltage
fluctuation graph.
Pre-trigger is fixed to 0.5 second and
recording length to 10 seconds.
Although only one fluctuation graph is
stored in internal memory, you can
read multiple fluctuation graphs by
using a PC card.