2.2 Screen Names and Configurations
30
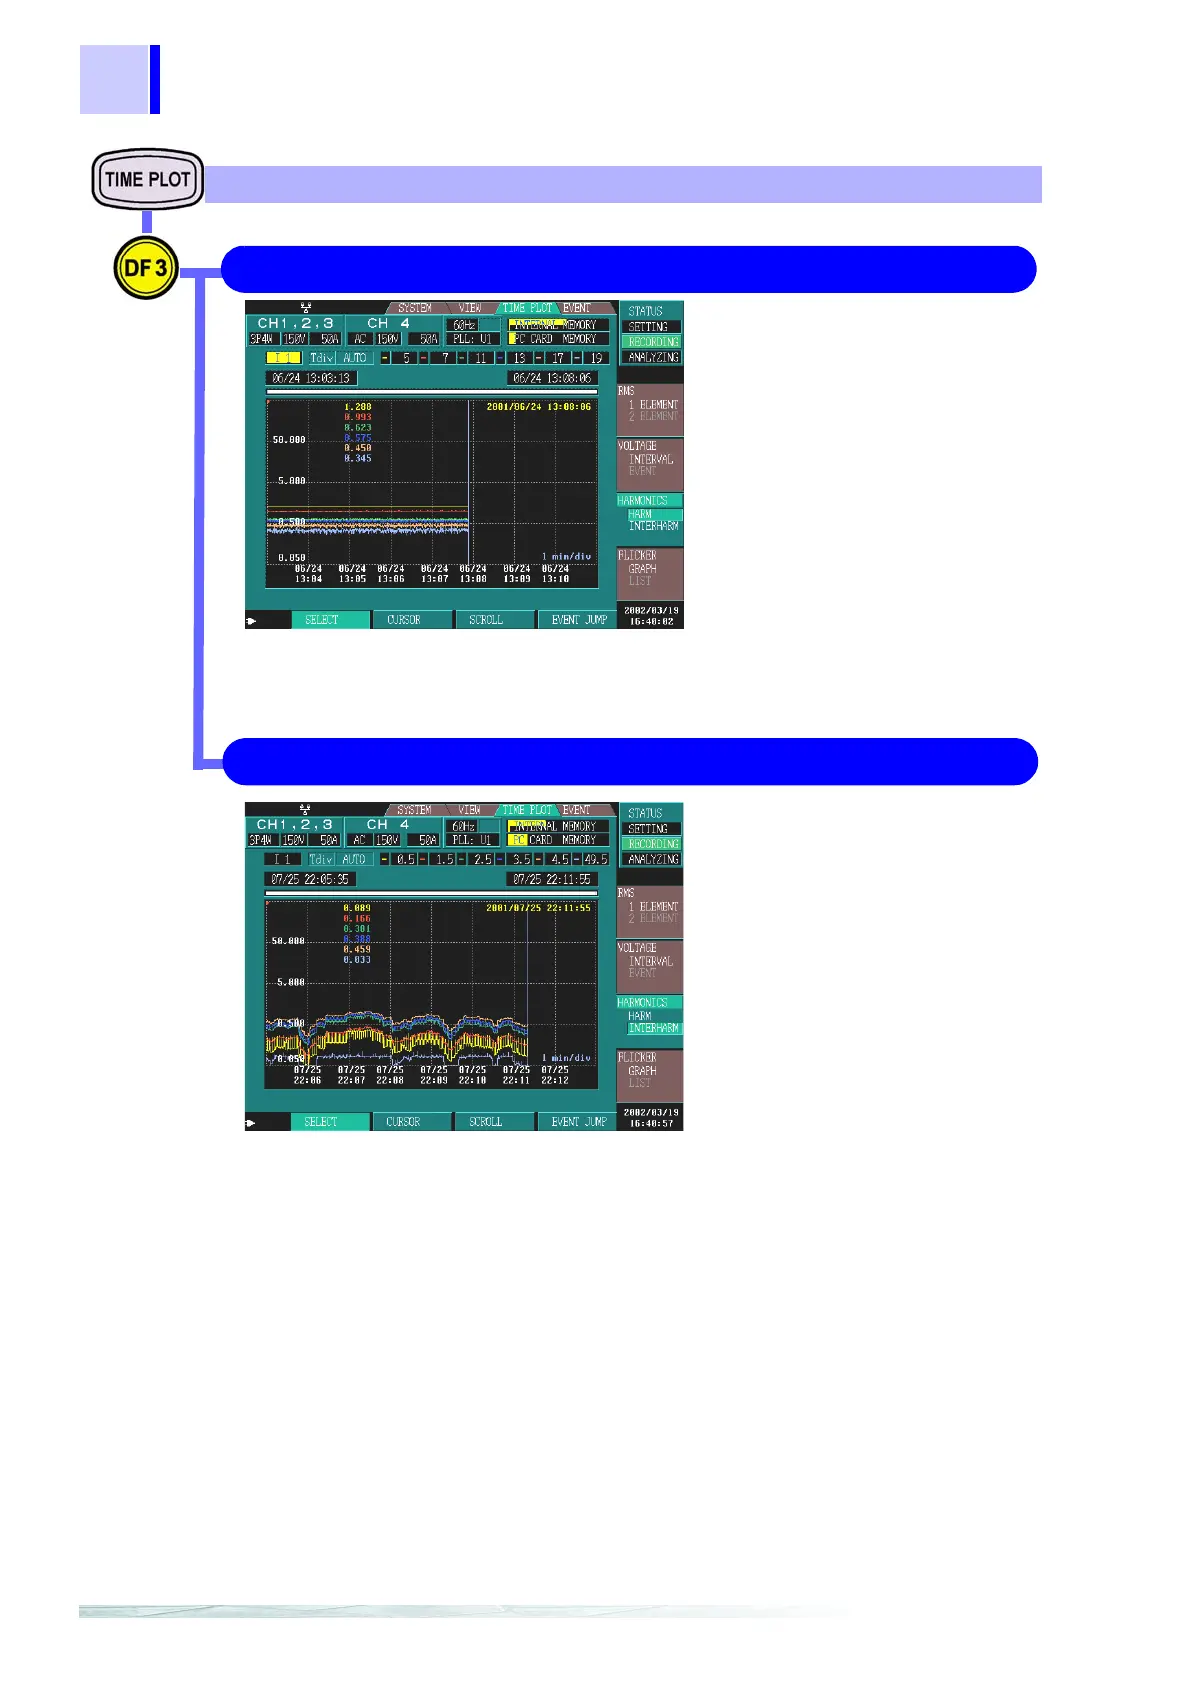
You can display a fluctuation graph fo
a single inter-harmonic selected from
the following.
• Inter-harmonic voltage
(RMS value and content percen
age)
• Inter-harmonic current
(RMS value and content percen
age)
This cannot be displayed when mea-
suring 400 Hz.
You can select 6 orders to be dis-
played simultaneously from 0.5th to
49.5th order.
Recorded data is not displayed unles
it is shown in P&Harm or ALL DATA in
[SYSTEM]-DF2[RECORDING].
HARM 6.5 "Changes in Harmonics"(page 100)
HARMONICS TIME PLOT Screen
You can display a fluctuation graph for
a single harmonic selected from the
following.
• Harmonic voltage (RMS value, con
tent percentage, and phase angle)
• Harmonic current (RMS value, con
tent percentage, and phase angle)
• Harmonic power (RMS value and
phase difference)
You can select 6 orders to be dis-
played simultaneously from orders 1 to
50 for the basic wave.
Recorded data is not displayed unless
it is shown in P&Harm or ALL DATA in
[SYSTEM]-DF2[RECORDING].
Up to 10th order harmonics can be dis
played when measuring 400 Hz.
INTERHARM 6.5 "Changes in Harmonics"(page 100)