2.2 Screen Names and Configurations
31
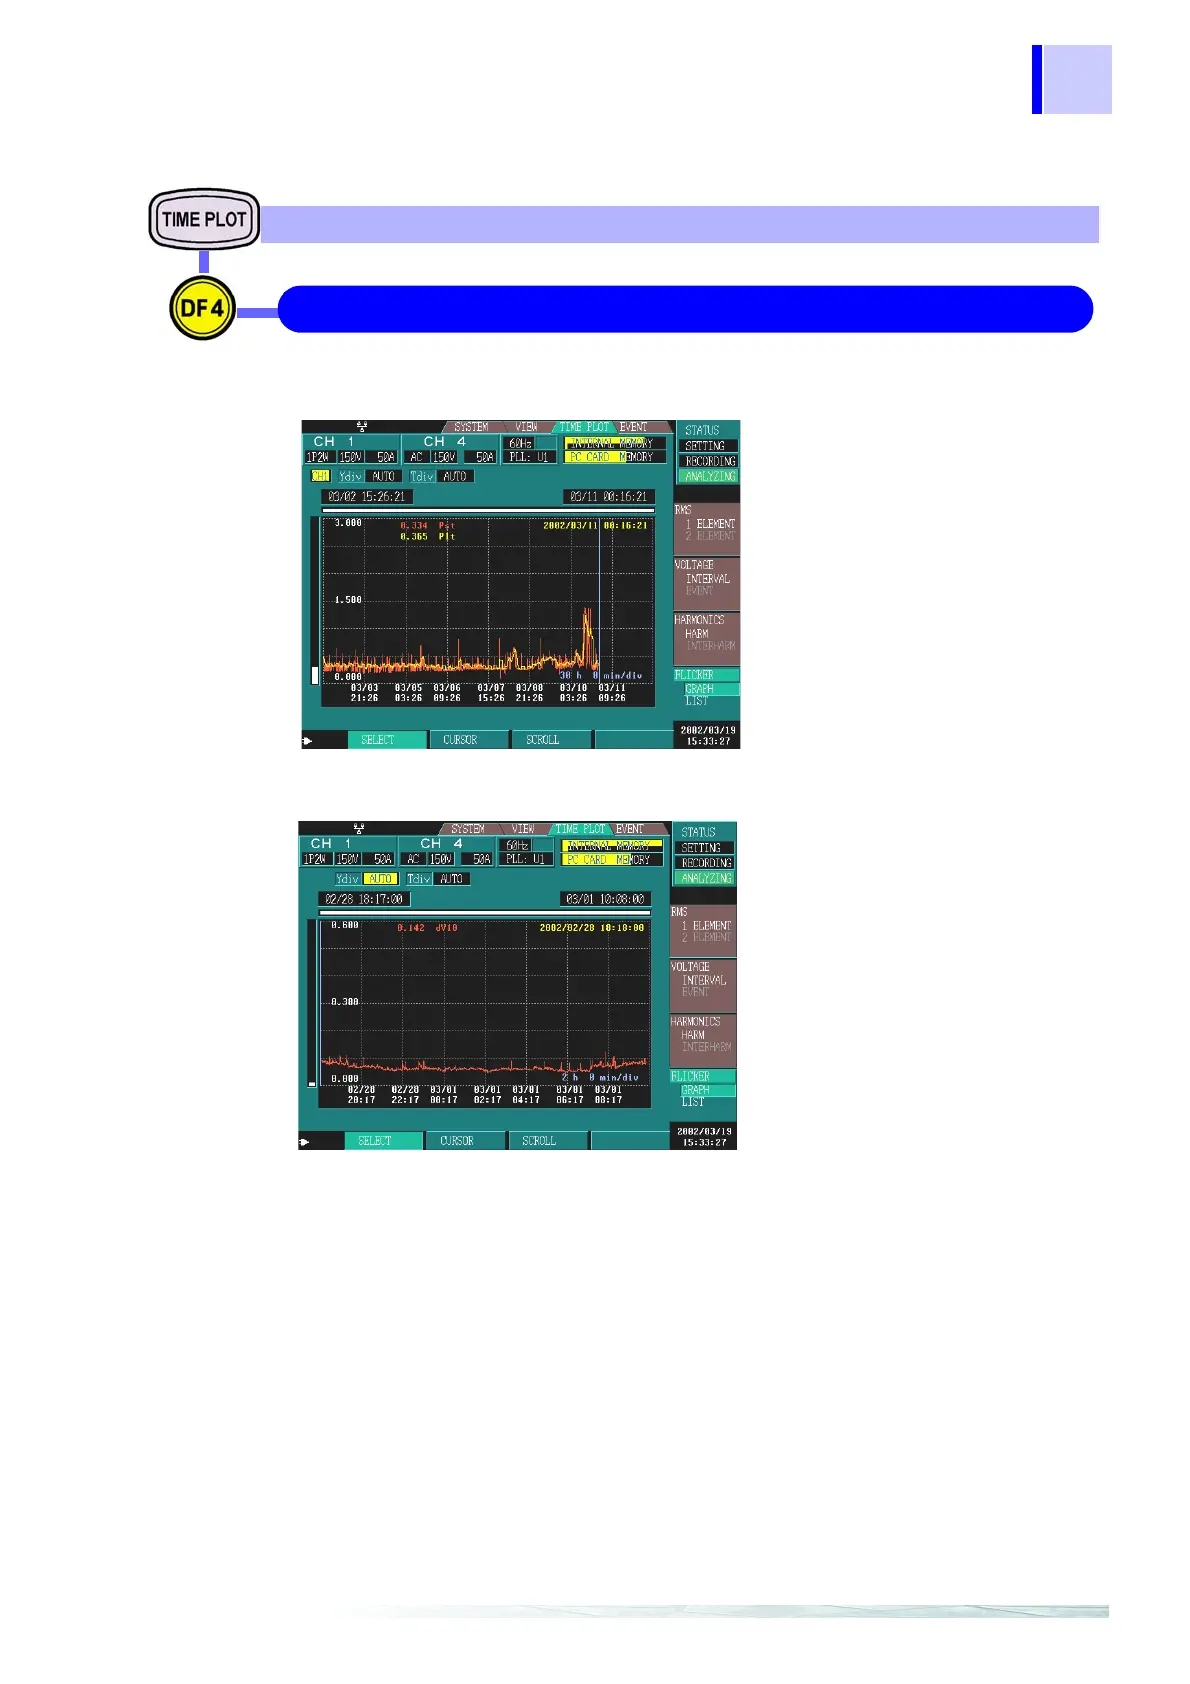
Displays a fluctuation graph for ΔV10
flicker.
The graph is updated once a minute, re
gardless of the interval that is set for
[SYSTEM] - DF2 [MAIN] - [RE-
CORDING]
.
This is only displayed if
Δ V10 is selec
ed for flicker in [SYSTEM] - DF2
[MAIN] - [MEASURE]
.
GRAPH 6.6 "Flicker"(page 104)
FLICKER TIME PLOT Screen
Displays a fluctuation graph for IEC
flicker (Pst, Plt).
The graph is updated every 10-minute
regardless of the interval that is set for
[SYSTEM] - DF2 [MAIN] - [RE-
CORDING]
.
This is only displayed if Pst, Plt is se-
lected for flicker in
[SYSTEM] - DF2
[MAIN] - [MEASURE].
Displays a graph for IEC flicker or ΔV10 flicker
IEC Flicker
ΔV10 Flicker
Flicker analysis is not available when measuring 400 Hz.