7.3. Thermal Evaluation Screen
After the sonication energy is applied, the system displays the Thermal Evaluation screen:
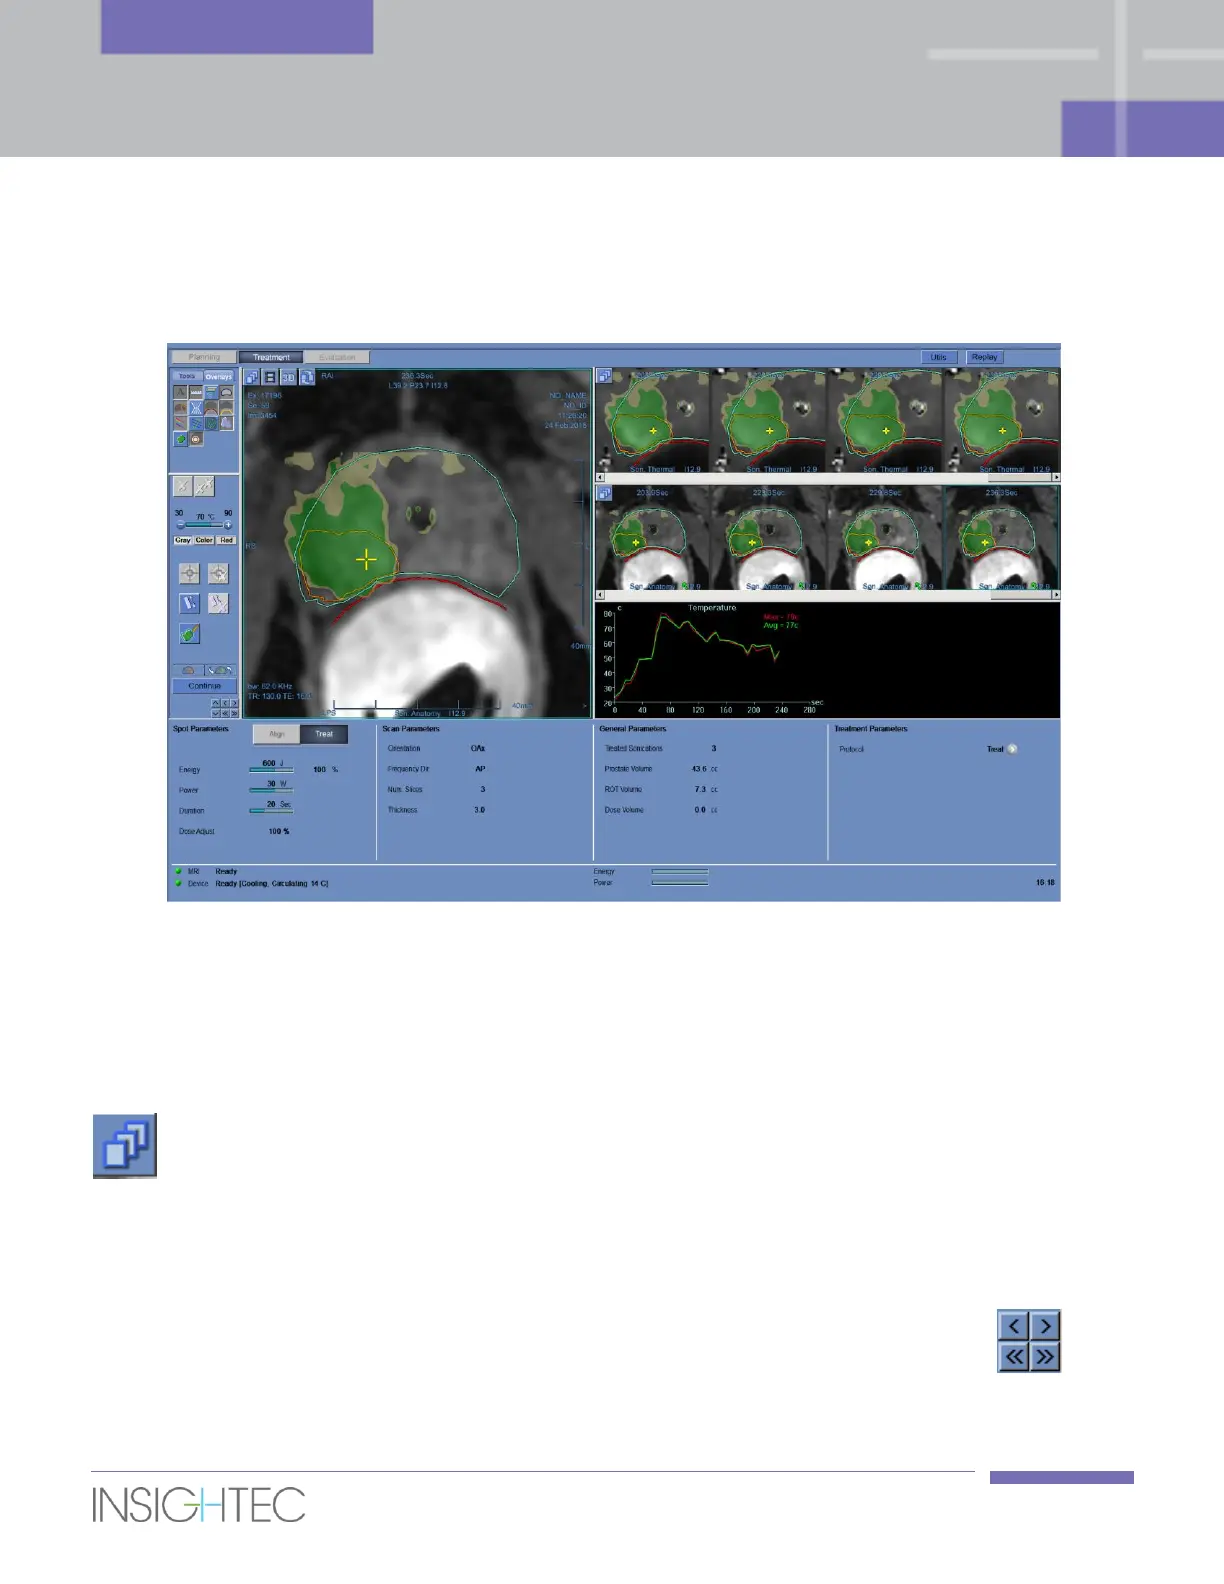
Figure 7-4: Thermal Evaluation Screen Elements
7.3.1. Image Strips
The top image strip shows the temperature maps acquired during the sonication.
The bottom strip displays the set of MR magnitude images taken during the sonication. The Image Strip
selection menu may be used to manually change this default setting.
For multi-slice thermal scans, the central slice is displayed.
The Selected Image window shows the MR image acquired closest to the end of the sonication. The
calculated thermal dose contours are superimposed on the post-sonication temperature maps.
To navigate through the MR images along time, use the Keyboard Right and Left Arrows or the
buttons, or alternatively click on the desirable image.