The graph may be used to display the temperature history of any location by moving the
cross-shaped cursor with the mouse.
[N-32]
7.3.7. Acoustic Spectrum
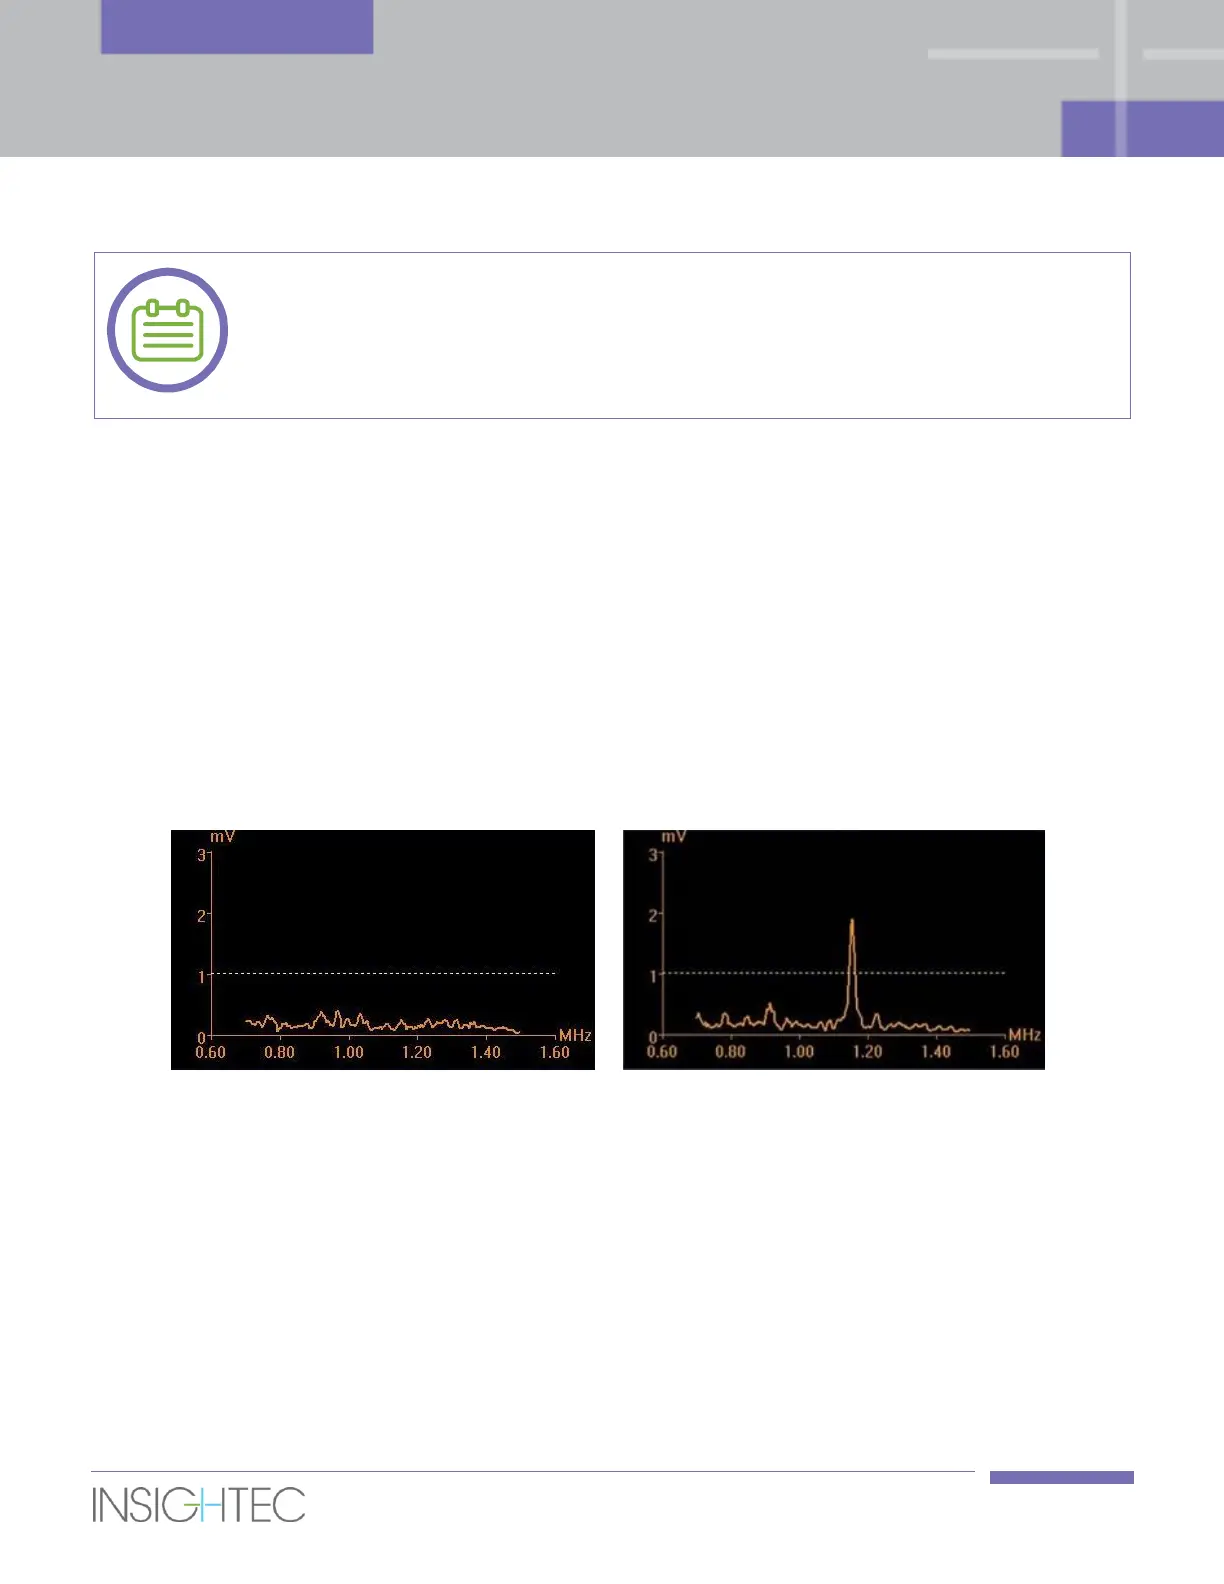
To enhance treatment safety monitoring, an Acoustic Spectrum Data graphs is displayed during the
sonication; it is displayed as soon as the sonication begins.
This graph presents the spectrum of frequencies that are transmitted back to the transducer, which assists
in detecting the potential creation of microbubbles – a first sign of cavitation effects.
Acoustic spectrum peak exceeding the 1mV threshold line at a frequency of 1.15MHz, is indicative of
potential start of cavitation effect.
If this occurs during a sonication, press the Stop Sonication button to instantly stop the sonication, reduce
the acoustic power (by ~10%) and repeat the sonication. If needed, keep gradually reducing the acoustic
power until the “peak” of the acoustic graph is well below the 1mV threshold line.
Figure 7-7: Acoustic Spectrum Graphs (left - typical, right – Cavitation effect)
7.4. Treatment Procedure
7.4.1. General Sonication Flow
1. Add a Macro-spot in the desired ROT slice. For safety considerations of sphincters preservation, it is
advisable to keep the sonications execution order from the sphincter and away.
2. Examine the next spot to be sonicated:
◼ When highlighted in green, the spot is valid and may be treated.