Affinity
2.0
Additional Information Page 137
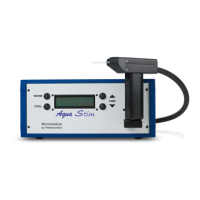
Figure 1: Cochlea from a 25-year old man who had been exposed to gunshots. The dark lines show auditory
neurons. There are no neurons coming from the basal part of the cochlea, indicating a dead region.
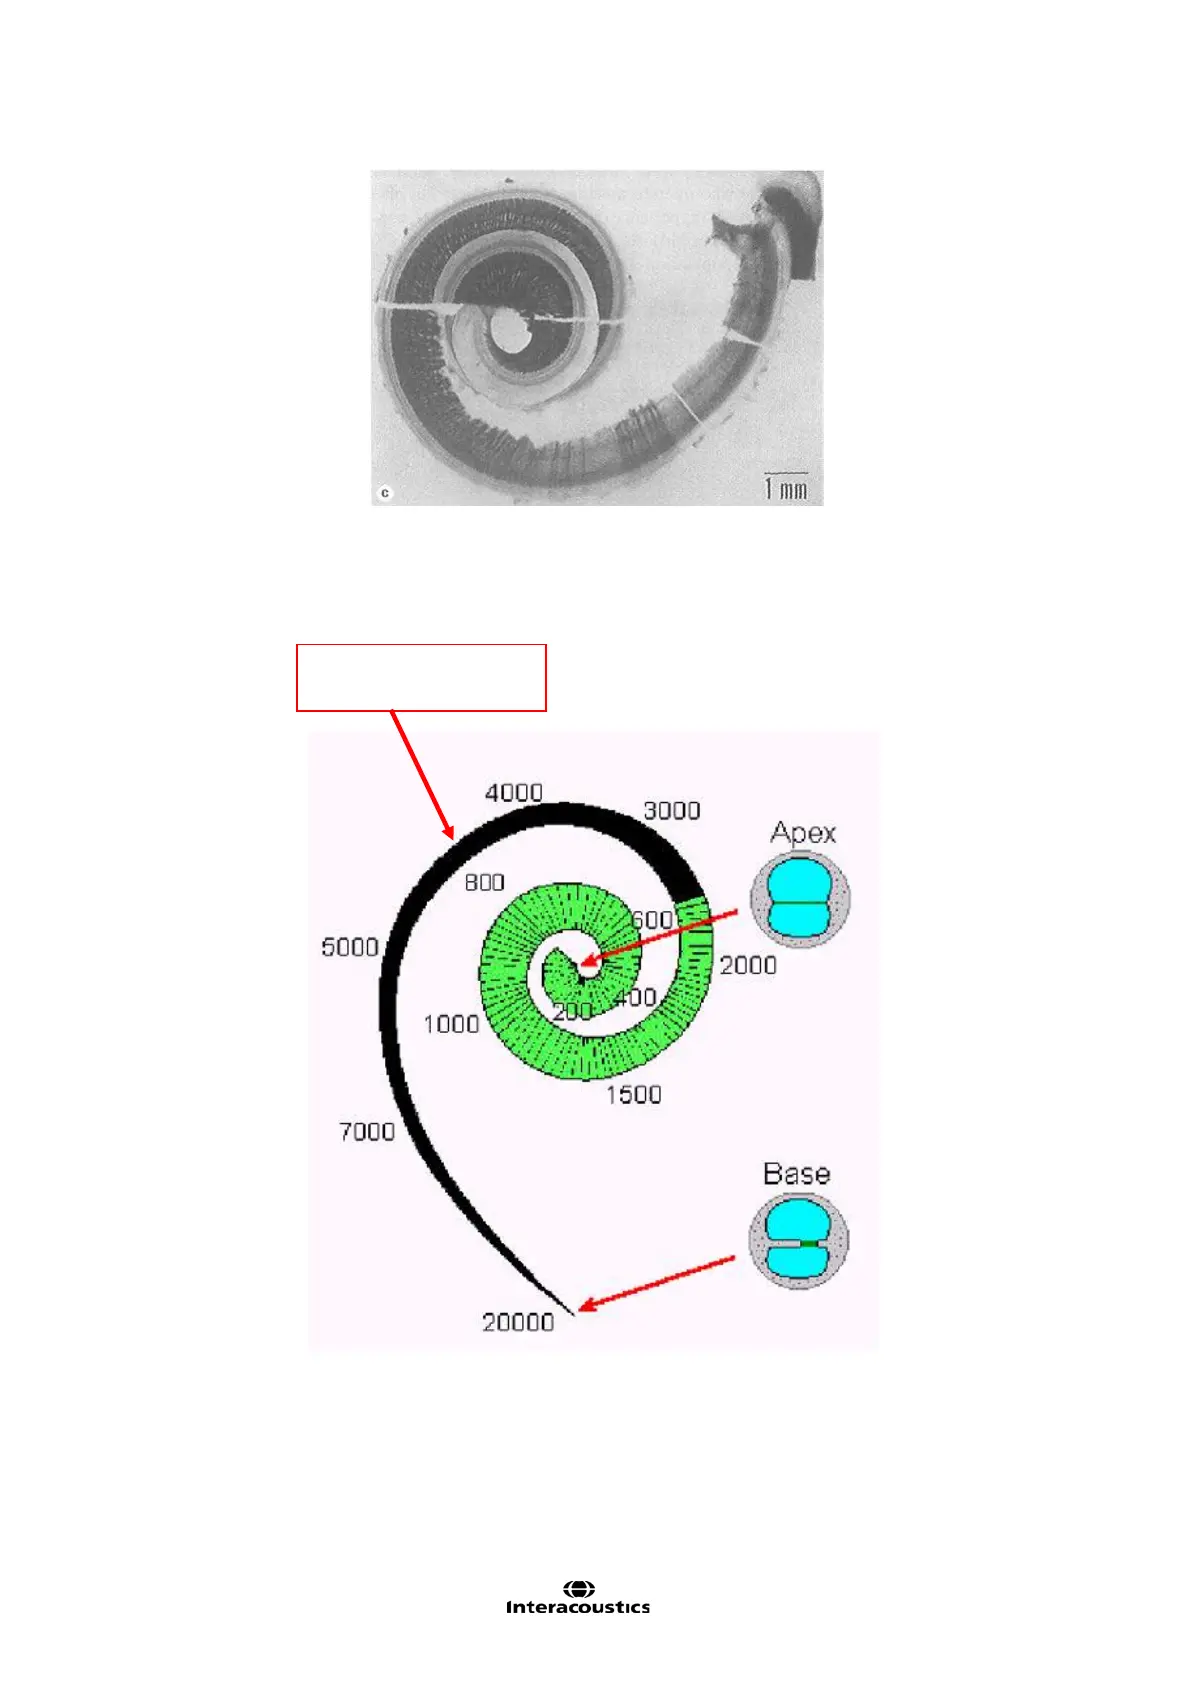
Figure 2: Illustration of how the edge of a dead region can be related to frequency in Hz, using a frequency-
to-place map of the cochlea. In this example, the dead region starts at an edge frequency of about 2500 Hz,
and extends upwards towards higher frequencies.