Affinity
2.0
Additional Information Page 250
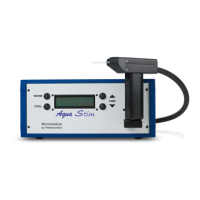
1. The ear/coupler mode indicates which side is
being tested next to a label showing whether
the test is performed in an aided or unaided
ear.
2. SII (Speech Intelligibility Index) of the
current input signal is expressed in a
percentage.
3. UCL (Uncomfortable Levels) will be shown in
shading at the top of the graph if entered in the
audiogram screen.
4. Hearing thresholds converted to SPL is
indicated in shading at the bottom. Together
with the UCL they form a dynamic range
view.
5. Hearing aid response is indicated in blue/red
(corresponding to the ear tested). This is
compared to the chosen fitting target indicated
in grey.
6. Display peaks and valleys/Percentile
ana lysis is indicated as a blue/red shaded
area (corresponding to the ear tested)
surrounding the hearing aid response (see
more information in section 0 and 0)
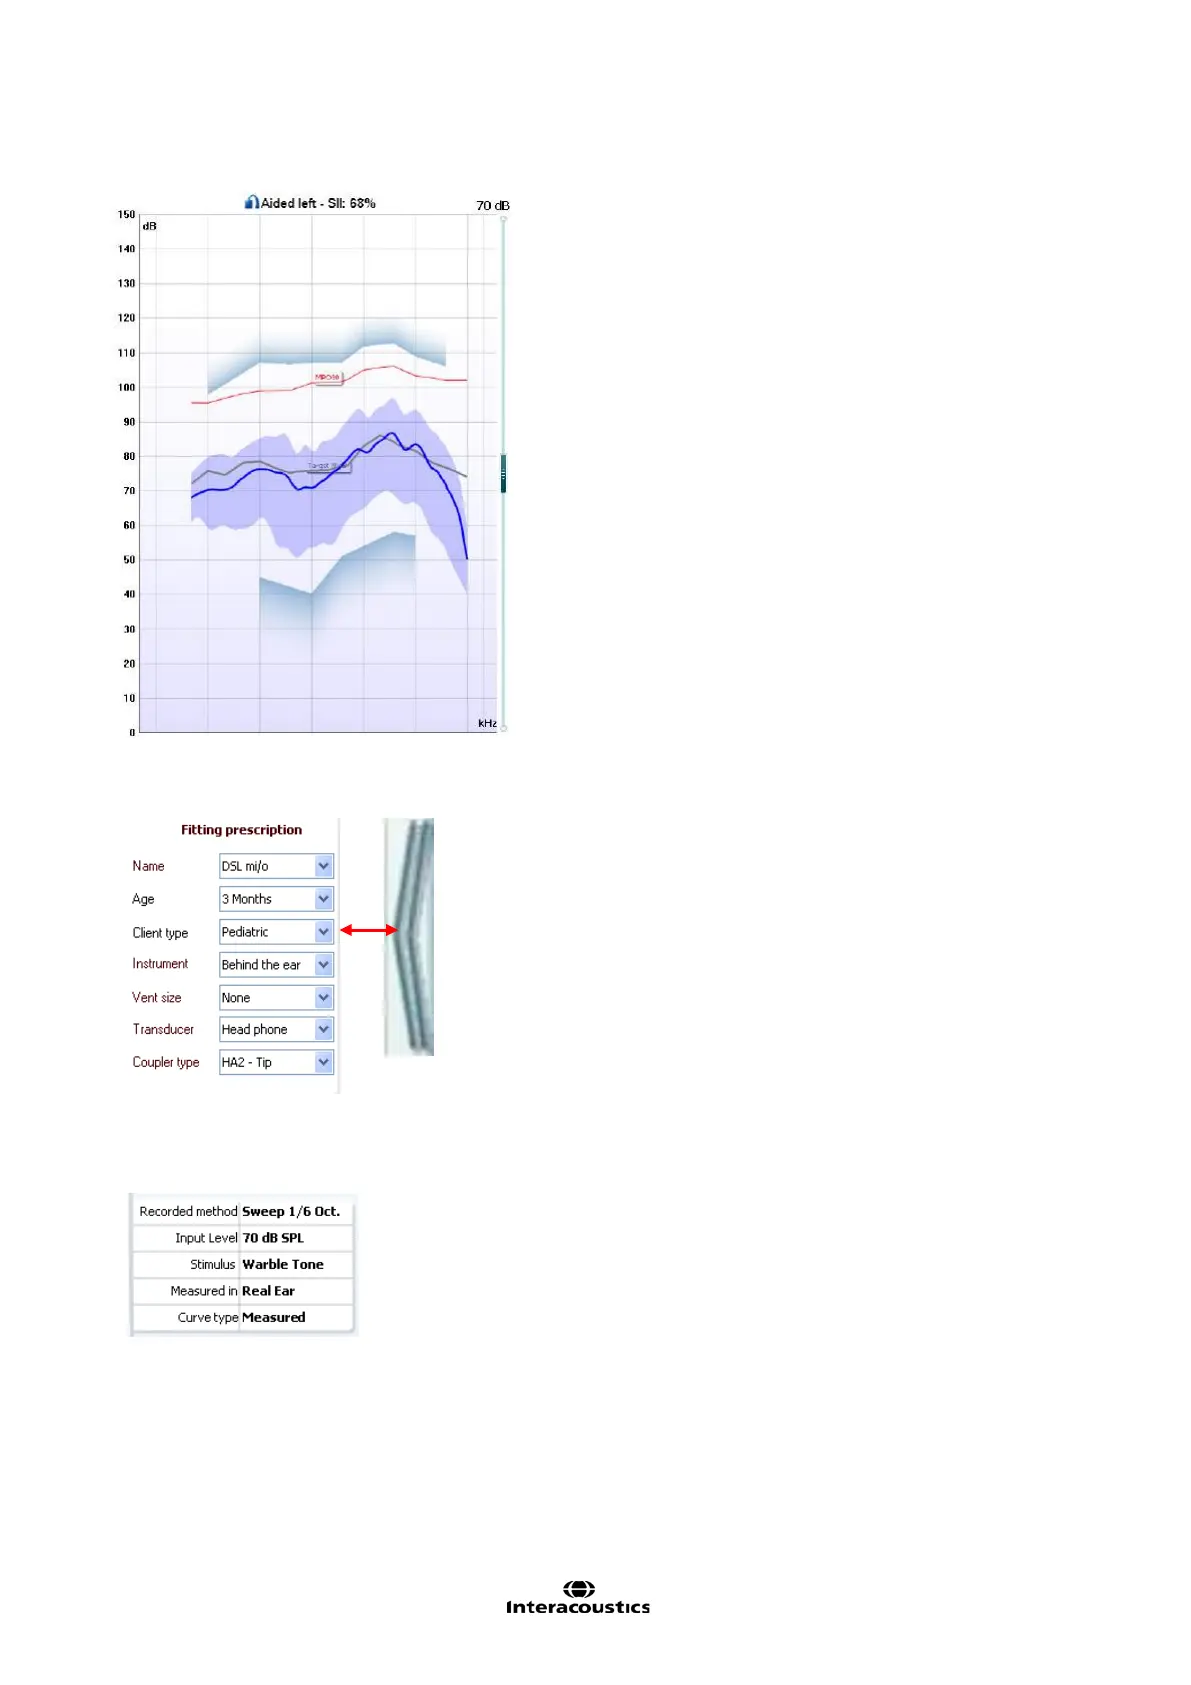
Show/Hide fitting prescription and test
information: Using the arrow to the right you can
choose to show or hide fitting prescription details
and test information.
The dropdowns allow for changing details during the
measurement.
Choose a fitting prescription from a selection of
Berger, DSL m[i/o], Half Gain, NAL-NL1, NAL-NL2,
NAL-R, NAL-RP, POGO1, POGO2, and Third Gain.
Based on the selected fitting prescription (and the
audiogram) targets are calculated and shown in
Visible Speech Mapping screen if NO audiogram
has been entered into the audiogram screen no
targets will be displayed.
Note: fitting prescription settings (such as Age and
Client type) will differ depending on what fitting
prescription is selected.
Measurement details of the selected curve are
displayed as a table on the right hand side of the
screen.