Affinity
2.0
Additional Information Page 261
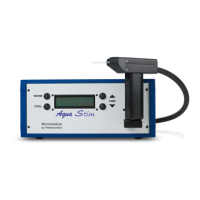
Measurement details: In this table the curve details can always be
viewed. This way the professional always has an overview of what
is being measured, for example, information such as Input Level,
Max SPL, Curve Type, Stimulus, and Curve type.
A Curve Comment for each curve can be typed into the comment
section on the right hand side.
Select a curve using the curve tag boxes under Curve display
options and write a comment in the comment section.
The comment will then appear in the comment section whenever
the curve is selected.
Curve Display Options are found in the lower right hand corner.
If you have measured more curves of the same type (e.g.
Frequency response curves), they will be listed by their input level.
Tick the ones that are to be displayed on the graph. Right clicking
on this option will allow you to change the curve’s colour or delete
the curve.
Affinity
2.0
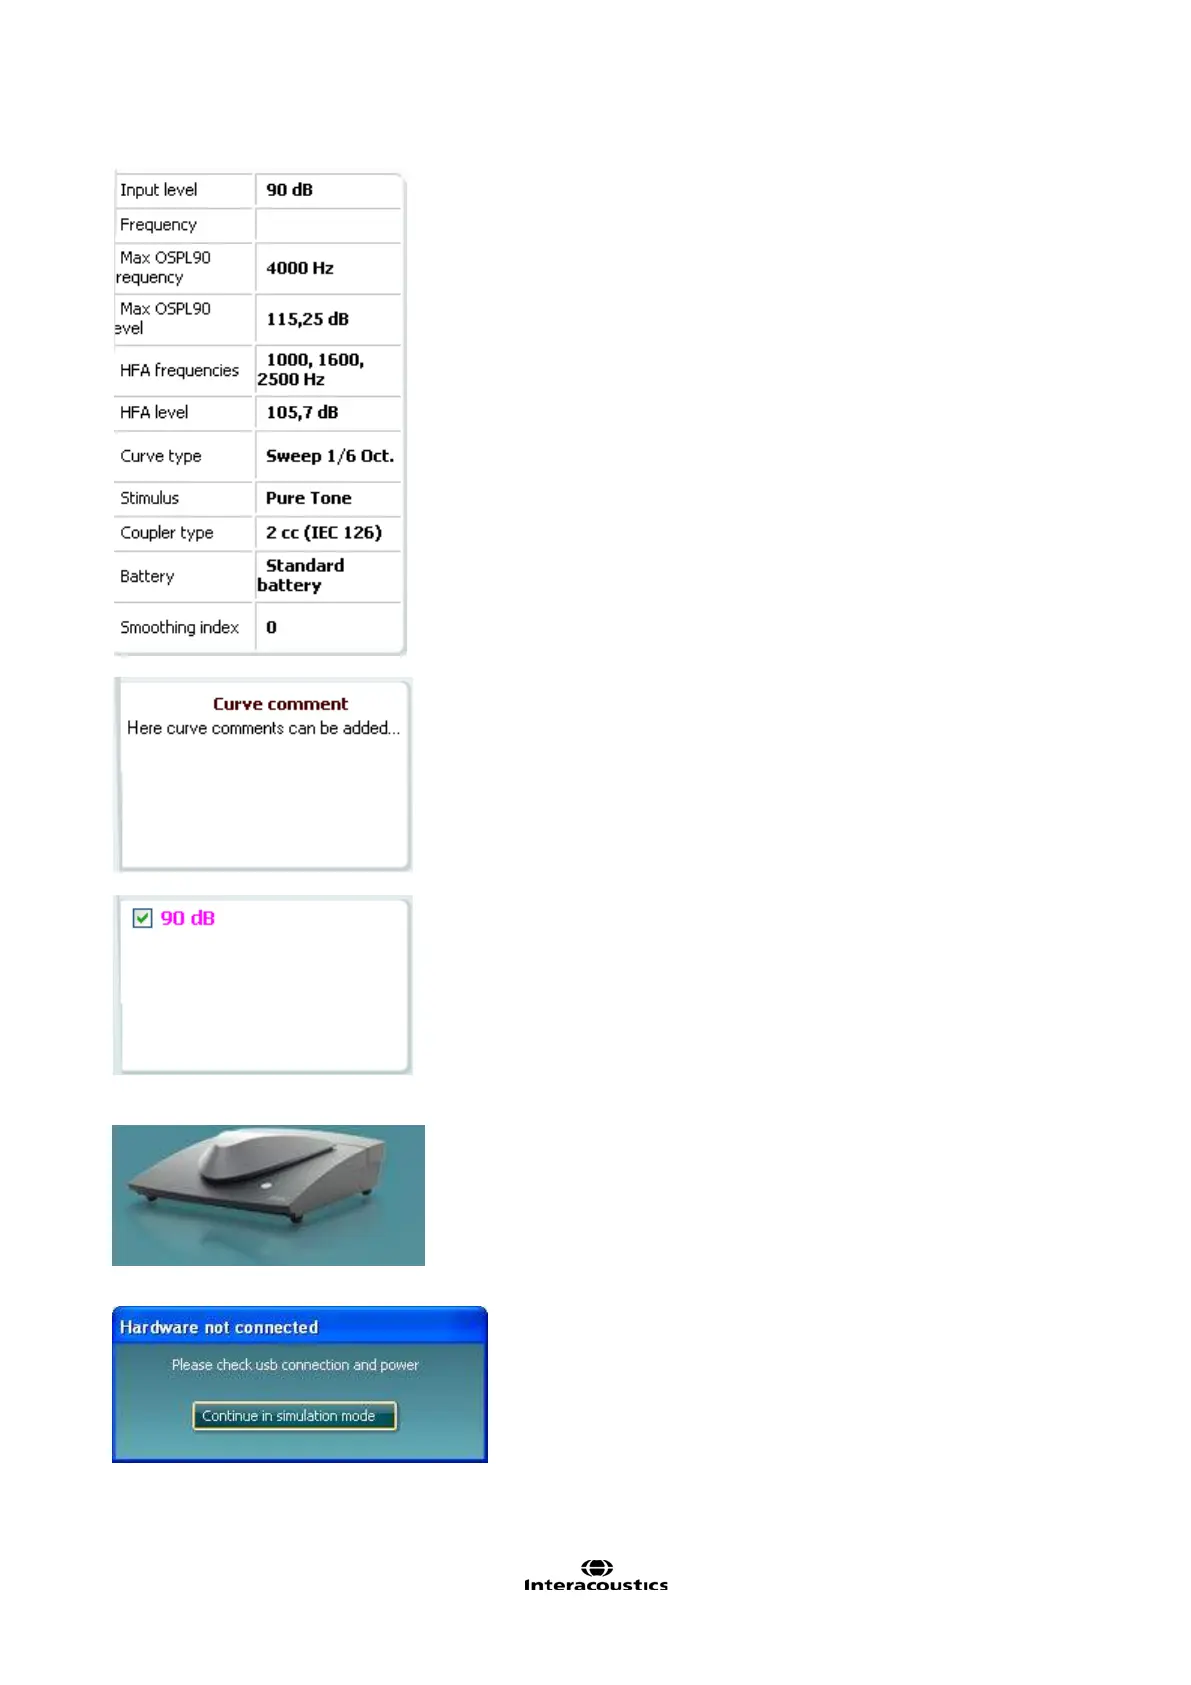
: The picture indicates whether the
hardware is
connected.
When opening the Suite the system will automatically search for the
hardware. If it does not detect the hardware a dialog box pops up
and asks if you want to continue in simulation mode.