Affinity
2.0
Additional Information Page 260
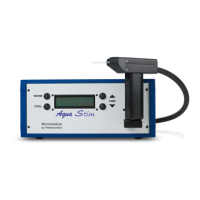
Current Protocol is listed in the lower left hand corner.
The indicates the test is a part of an automatic test flow (Auto Run).
When pressing START all tests with the tick mark will be performed.
If you wish to perform one test only, mark it using the mouse by
clicking on it. Then right click at select Run this test.
Upon performing a test the system automatically jumps to the next one
in the test flow.
indicates that a curve has been measured.
Colour indication shows the colour selected for each curve (in the
HIT440 setup, see section 0).
Test protocols can be created and adjusted in the HIT440 setup (see
section 0).
Start/Stop button initiates and ends all tests.
Note that after pressing START the text on the button will change to
STOP.
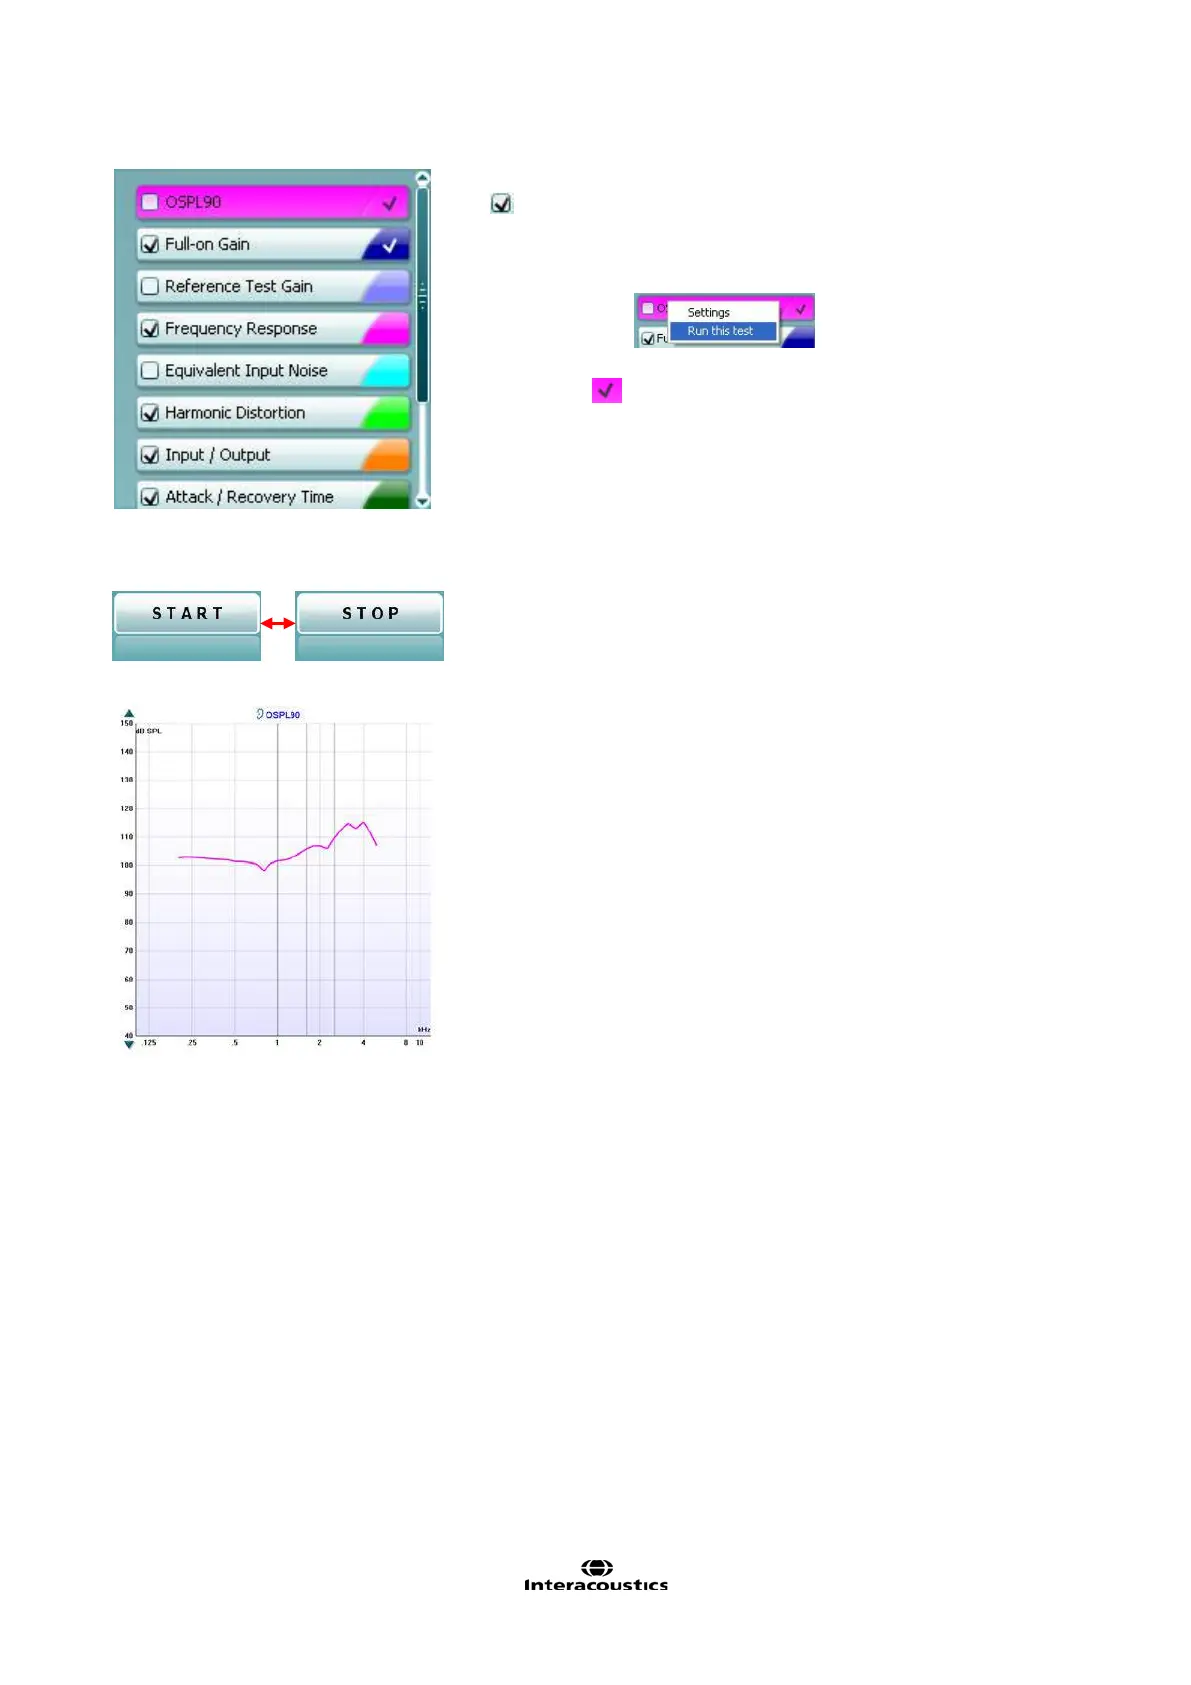
The Graph shows measured HIT curves. The X axis shows the
frequency and the Y axis shows the intensity of the test signal.
Measurement type is printed above the graph together with a
right/left indication. In this example the OSPL90 is displayed for the
left ear.
Change the input level using the slider on the right hand side.
Scroll graph up/down on the left hand side allows for scrolling the
graph up or down ensuring that the curve is always visible in the
middle of the screen.