3─96
3
3.9 OPERATE PERFORMANCE MONITOR
y
y y
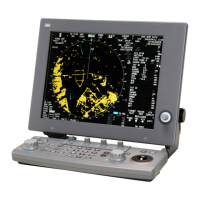
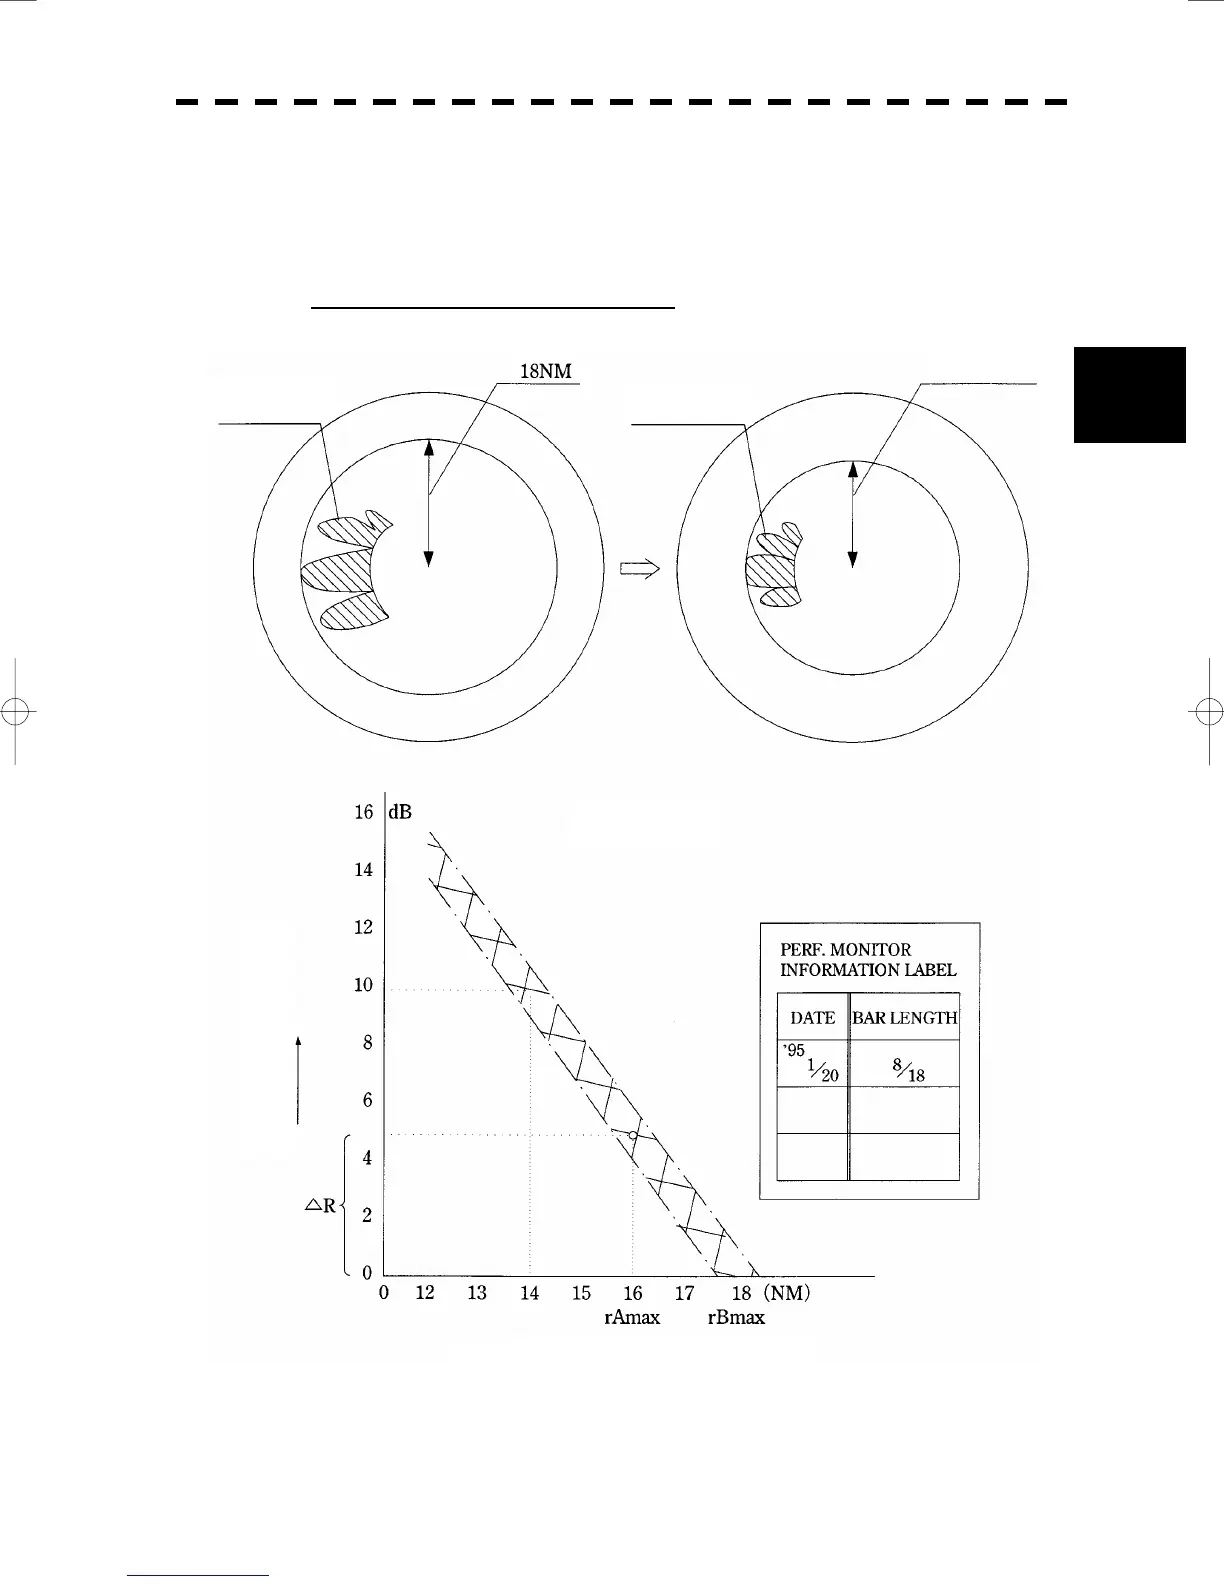
(Example) When the maximum range of the initial PM pattern rBmax = 18 NM as shown on the
INFORMATION LABEL and the maximum range of the current PM pattern rAmax = 16
NM, the reduction of sensitivity ΔR (rmax) = 5 dB is obtained according to the Calibration
Curve II. This proves that the receiver system’s sensitivity has reduced by about 5 dB.
Example of Checking Receiver System
Figure 4
Calibration Curve II
Reduction of Sensitivity R (rmax)
Maximum Range of PM Pattern (rmax)
Initial PM pattern Current PM pattern
About 16 NM
 Loading...