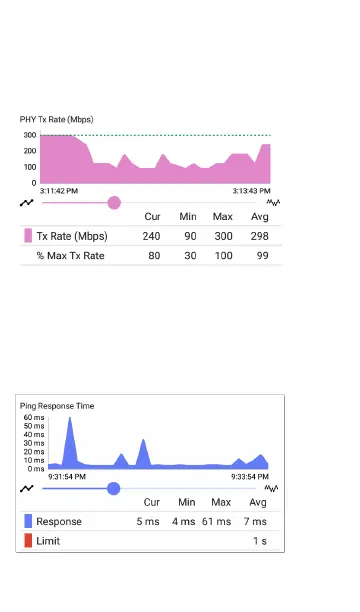
PHY TX Rate (Mbps) graph: Plots the physical
transmission rate. The green horizontal dotted
line shows the AP's maximum TX rate.
Ping or TCP Connect Response Time graph:
This graph displays on the Link test screen if you
run a Ping or TCP Connect test, using the
Ping/TCP app, over the Wi-Fi test port
connection while the Profile is linked.
AutoTest App and Profiles
279