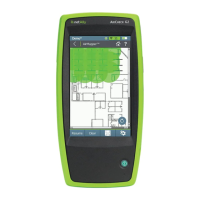
As shown in the image above, you can undo
previous collection points and rotate the image
as needed.
Use swiping and pinch-to-zoom gestures to pan
and zoom the map.
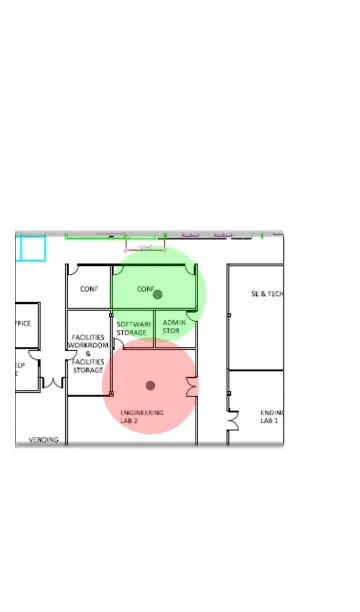
While the Product is scanning, the Signal
Propagation circle is red. Once the scan is
complete, the circle turns green.
The completed data points in the AirMapper app
are always green. The colored heatmap is
generated once you upload the AirMapper
results to Link-Live.
AirMapper™ App
657