Setting up Compax3 C3I22T11
274 192-120114 N5 C3I22T11 June 2008
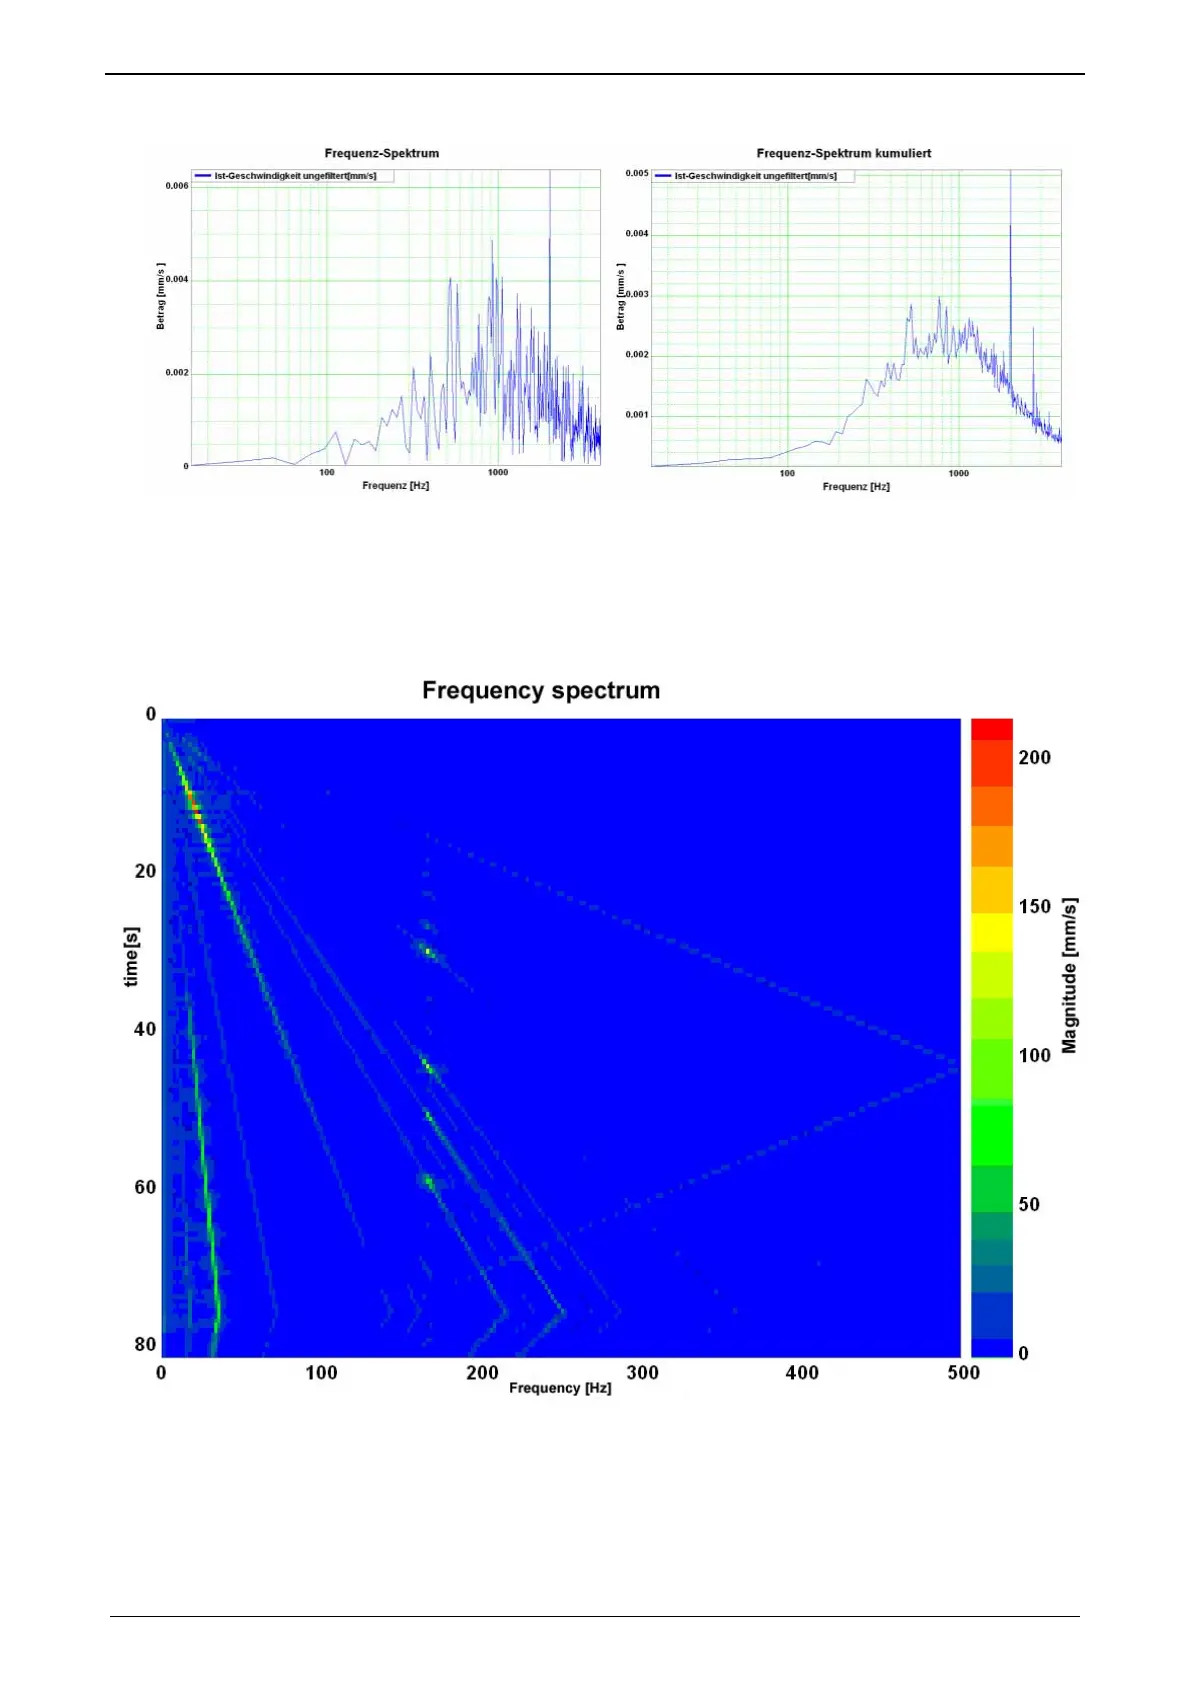
cascade diagram (c)
Frequency spectra are displayed subject to time. The information on the value of
the signal is color-coded.
Cascade diagrams of the velocity signal during an acceleration process
This kind of display is suitable for the analysis of temporal changes in the measu-
red spectrum.
 Loading...