Software Reference 109
P/N CLS151164 Rev. B LabChip GX Touch/GXII Touch User Manual PerkinElmer, Inc.
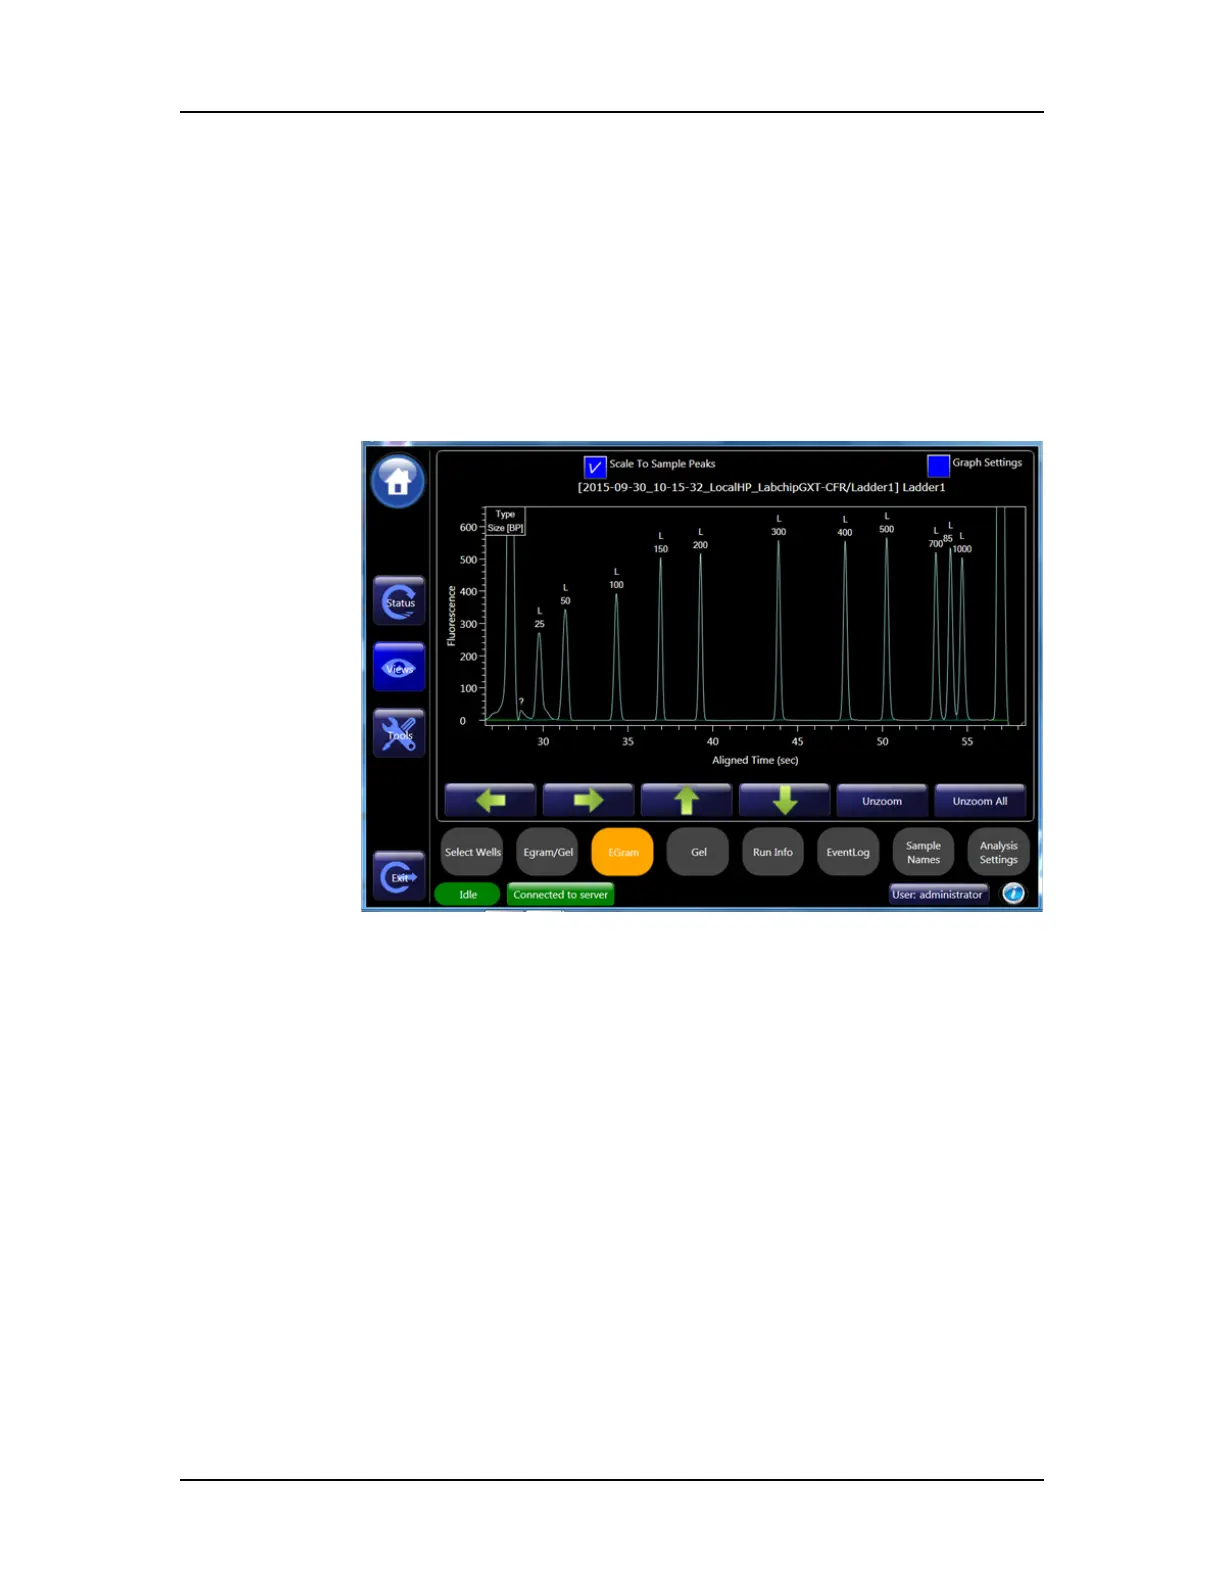
EGram Tab
The EGram Tab is a visual representation of the data from each well
as an electropherogram. A single well or multiple wells can be
viewed in the EGram tab.
Use the EGram Tab to view data from completed wells. To change
the view in the EGram tab, see Viewing Graphs in the Egram Tab
on page 52. To open the EGram tab, touch the Views button on the
Navigation Bar and then touch the EGram button.
Figure 42. EGram Tab
Touch and drag over a region on the electropherogram to zoom in.
Touch the Unzoom button or the Unzoom All button to zoom out.
Graph data can be exported to a graphic file at the end of the run by
choosing Auto Export on the Setup Run Tab. (See Defining a New
Plate Type on page 29 for details.)
To show or change the labels on the peaks in the graph, show the
data points on the graph, show peak baselines, show smears, or
change the graph colors, see Graph Settings on page 111.
While a run or calibration is in progress, the Status Window displays
the raw (unanalyzed) data as it is being read from the chip.
 Loading...